Link/Route time series analysis is a helpful tool to compare multiple (up to five) links and routes travel time and count data in a desired time range.
Based on the selected links and routes data interval, users will have this option to choose the granularity. Granularity defines as the time interval between two consecutive data points on the chart.
To select a Time Range:
- Click on the time range field to open the calendar.
- Select the start date and modify the time by using little arrow signs if it is needed.
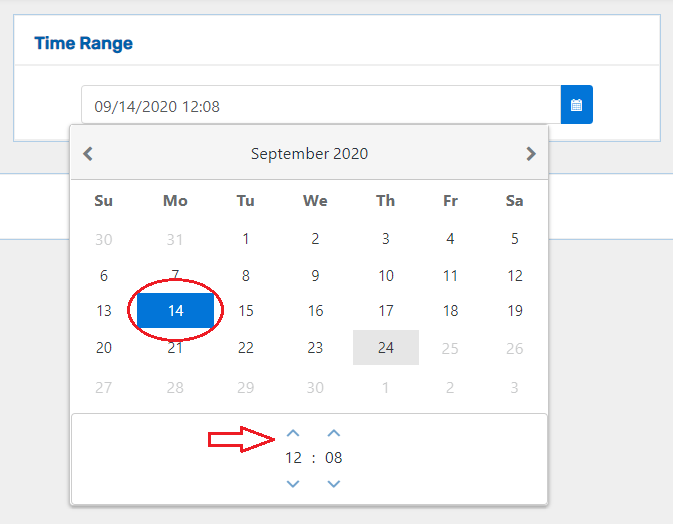
- Select the end date and time.
- Click on the calendar icon to close the calendar
 .
.
After click on the “analyse” button, you will see a travel time chart, as shown in figure 1:
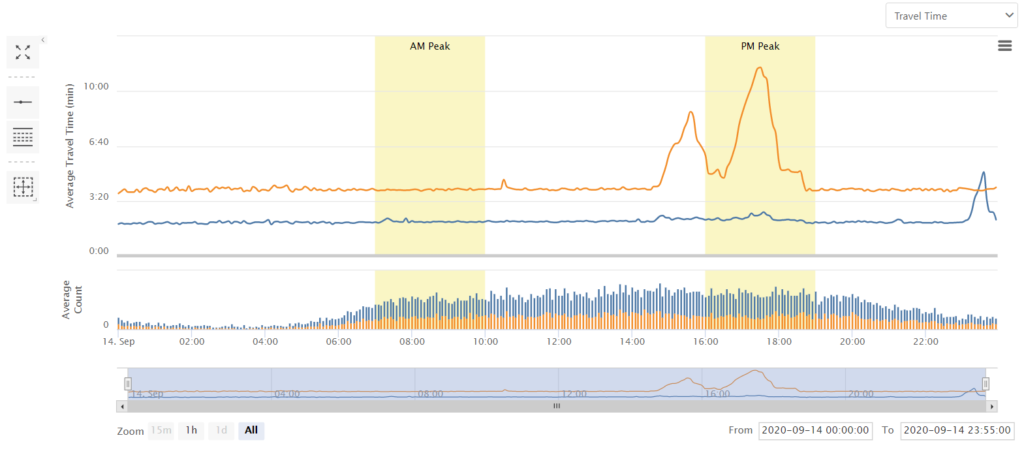
Tip: For more information about the chart options, please see the Insight Charts Guide.