24-hour link/route analysis allows users to see the aggregated links or routes data in a 24-hour format chart. Each set in this analysis represents a link or route that its data will be aggregated based on the selected granularity in the set’s specified time range.
For adding a new set:
- Click on the Add button.
- Choose a proper name for the set.
- Select a desired link or route.
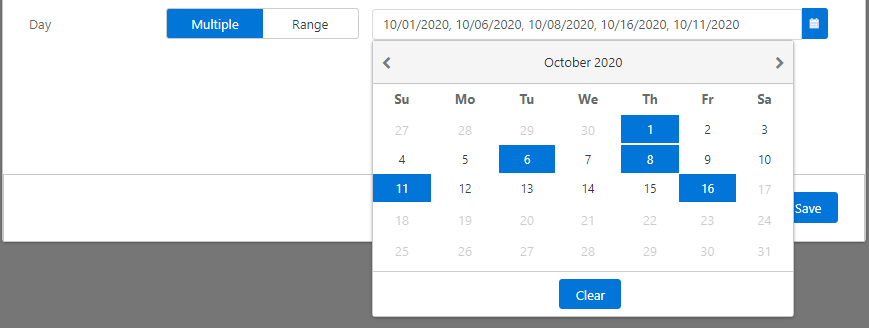
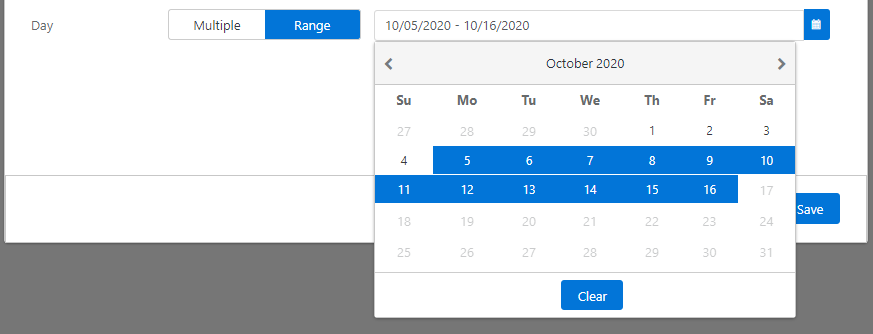
- Specify the time for data aggregation. There are two options:
- Multiple: Users can select multiple days one by one by clicking on the calendar.
- Range: For choosing a time range, first click on the start date and then the end date. All the days between the start and end dates will be selected automatically.
- Click on the “Save” button.
Granularity defines as the time interval between two consecutive data points on the chart. Less granularity shows more fluctuation in data.
After click on the “analyse” button, you will see a 24-hour travel time chart, as shown in figure 1:
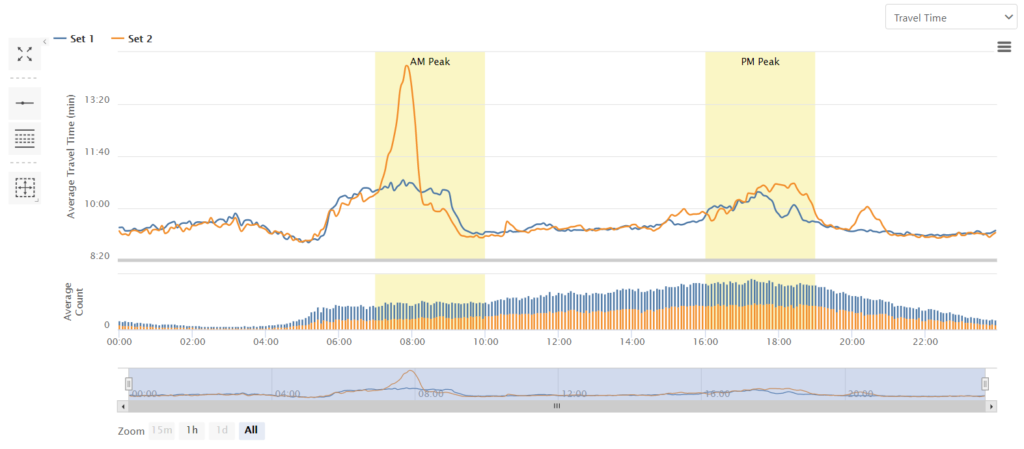
Tip: For more information about the chart options, please see the Insight Charts Guide.