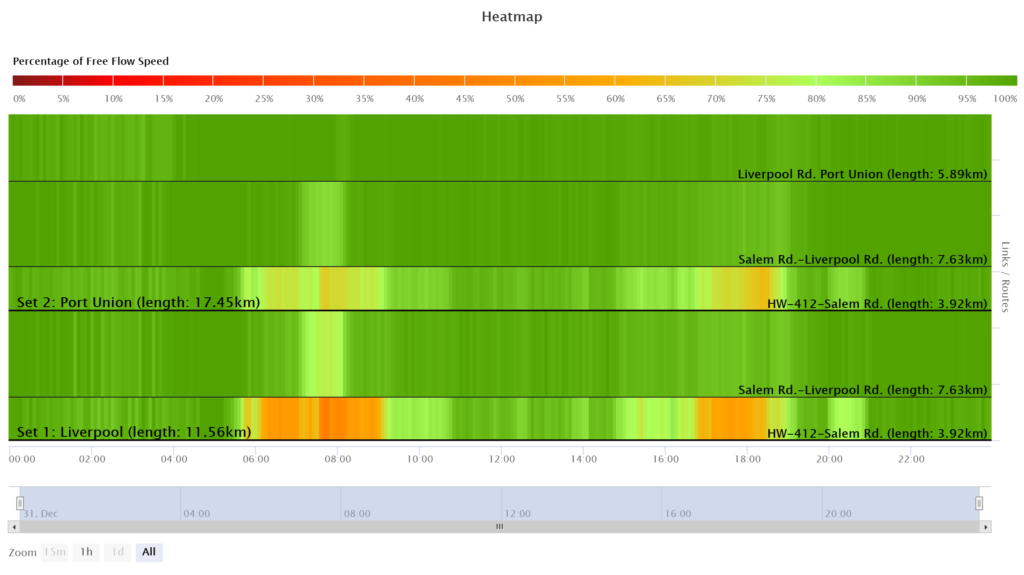
Heatmap analysis allows users to find and compare the routes bottleneck(s) at one glance. This analysis aggregates each link’s speed data in a route based on selected granularity and shows the average speed data with colors (from green to dark red) in 24-hour format. These colors indicate the level of congestion for each link compared to its free-flow speed.
For adding a new set:
- Click on the Add button.
- Choose a proper name for the set.
- Select a desired route.
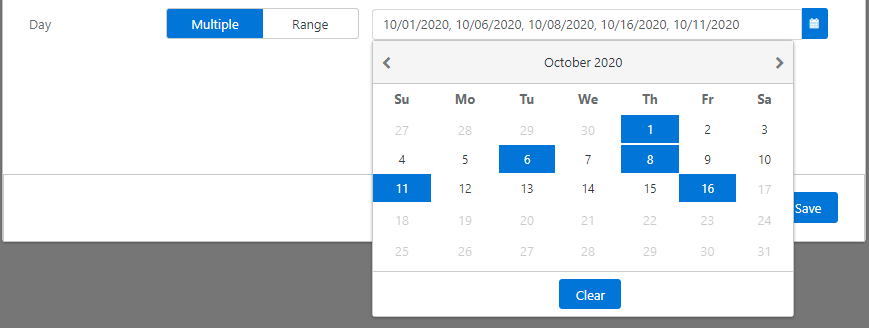
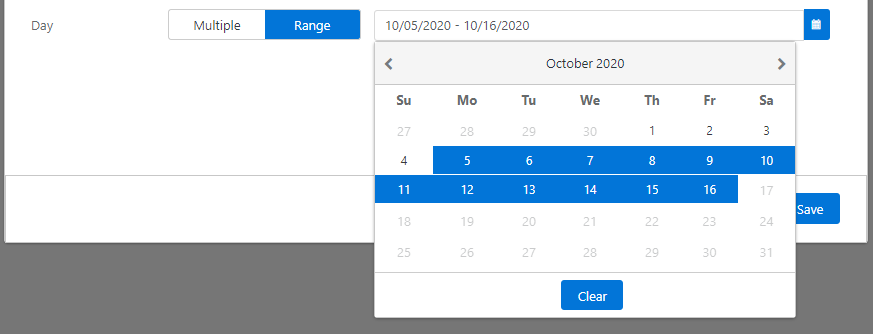
- Specify the time for data aggregation. There are two options:
- Multiple: Users can select multiple days one by one by clicking on the calendar.
- Range: For choosing a time range, first click on the start date and then the end date. All the days between the start and end dates will be selected automatically.
- Click on the “Save” button.
Granularity defines as the time interval between two consecutive data points on the chart. Less granularity shows more fluctuation in data.
After click on the “analyse” button, you will see a heatmap, as shown in figure 1: