Introduction #
With the Impression Study, you gain a comprehensive understanding of how your ads are being perceived by your target audience. The tool tracks key metrics such as total counts, unique counts, dwell time (the time duration an individual has been exposed to an ad), and visit frequency. These metrics are captured based on the detected MAC addressed so that you can make informed decisions and improve your advertising strategies.
Create an Impression Study #
Now we will create a new study. Start by pressing the ![]() button on the top right corner to create a new impression study. You will be brought to the Information page; provide a name and description for your study to help identify it later and then click the
button on the top right corner to create a new impression study. You will be brought to the Information page; provide a name and description for your study to help identify it later and then click the![]() button on the bottom right.
button on the bottom right.
You will be brought to the Configuration page, here, we will add sets. Each set includes one or more sensors and a time duration. To add a set, press ![]() on the bottom left. Provide a name for the set to help identify it later and select the sensors you would like to add to the set. You can also select the sensors on the map by clicking one of the markers which indicates a sensor. A red marker
on the bottom left. Provide a name for the set to help identify it later and select the sensors you would like to add to the set. You can also select the sensors on the map by clicking one of the markers which indicates a sensor. A red marker  means it sensor is not selected, and a green marker
  indicates that it is selected for the set.
Once you have selected your sensors for your set, select the days you would like to study by choosing “Multiple” or “Range” and then selecting your desired days on the calendar and the hours of the day. The “Scale Factor” can be configured to provide the preferred direction(s) of traffic that will be included in the set. You can adjust the detection range of the sensor by clicking on the “Advanced Settings” drop-down menu and changing the RSSI values. Click on the “Save” button to add that set.
You can configure the minimum time between two visits and the maximum dwell time below the table. Once you have added your desired sets, press ![]() to proceed to the Summary page. Make sure the information for the Impression Study is correct, and then press “Submit”.
to proceed to the Summary page. Make sure the information for the Impression Study is correct, and then press “Submit”.
Analysing Impression Data #
Once the process is completed, you can click on a name of a study to be able to view the information in more detail, edit it, view charts, and see a report. On the Impression Study List, you can click on a name of a study to be able to view and edit information, view charts, and view the report.
Info #
On the Info page, you can view all the information for your Impression Study and edit it. You can also view all of your sets and their data.
Charts #
Here are some of the charts you will find on this page:
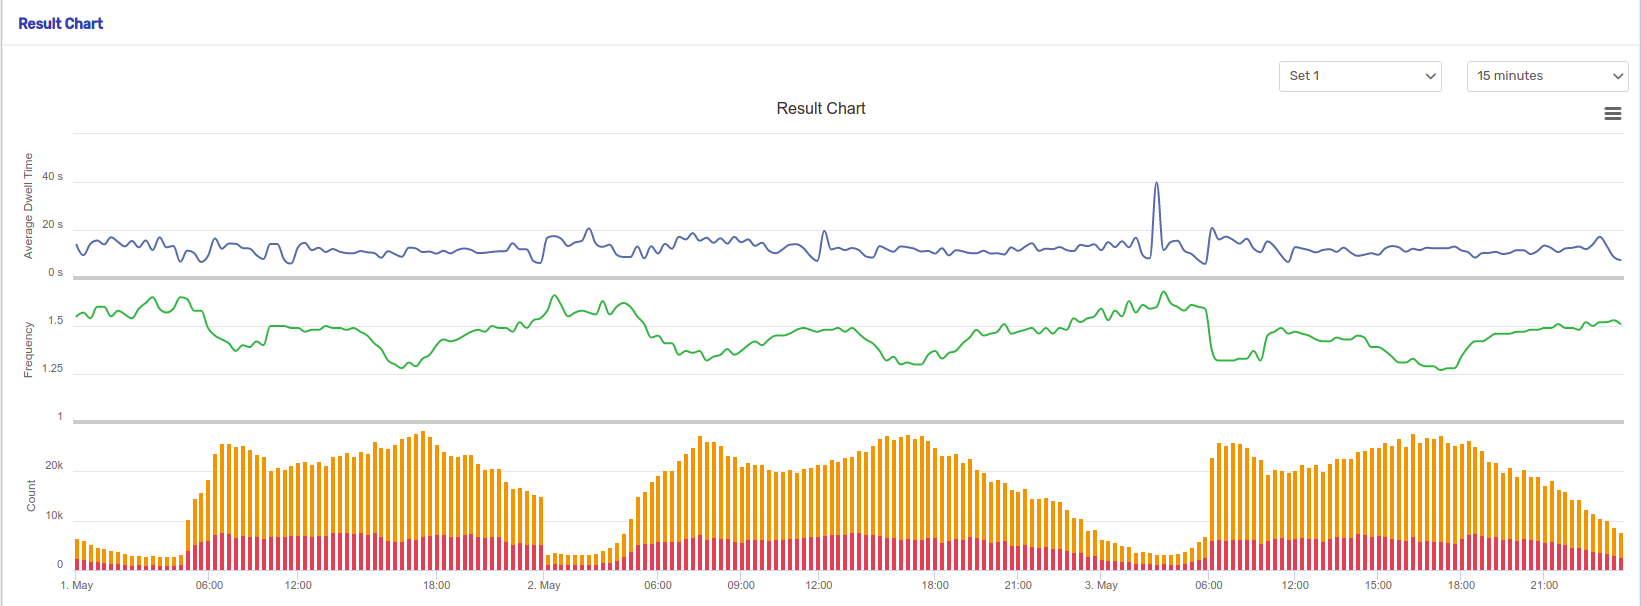
Result Chart
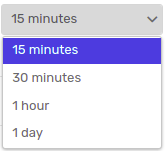
On the top right of the Result Chart, you can select the set and aggregation interval to be shown.
where, you can see three charts: the Average Dwell Time, Visit Frequency, and Unique and Repeat Counts.
15 Minute Interval:
30 Minute Interval: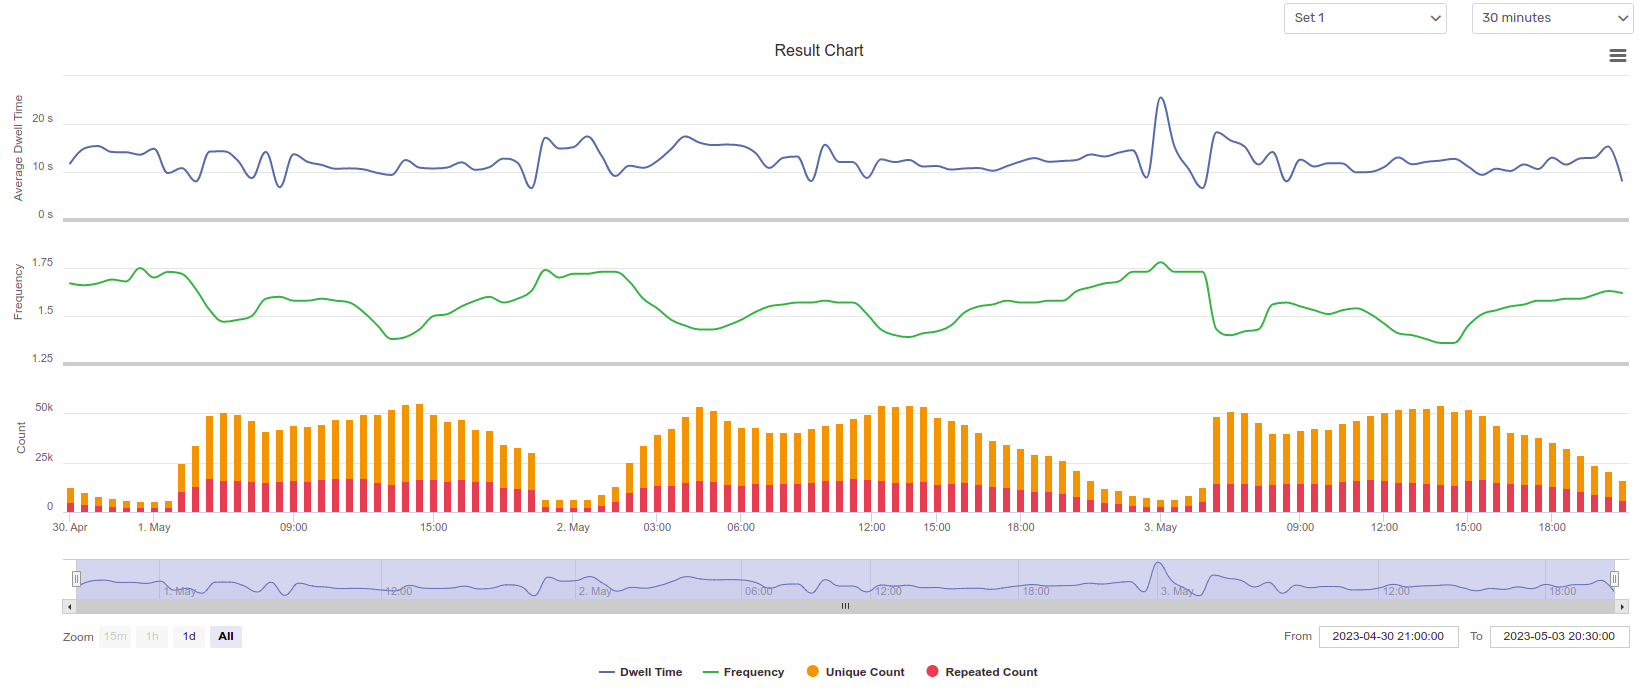
1 Hour Interval: 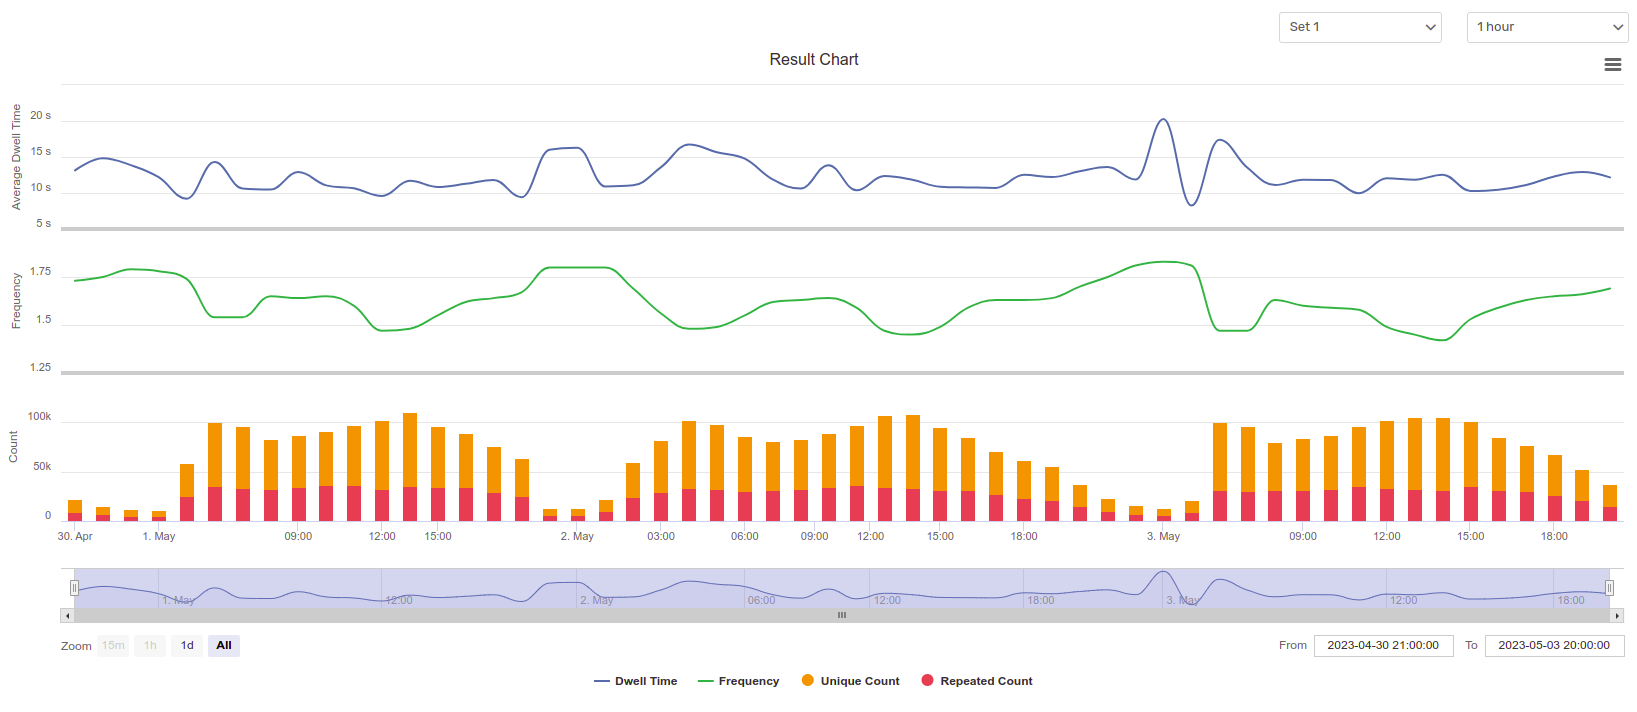
1 Day Interval: 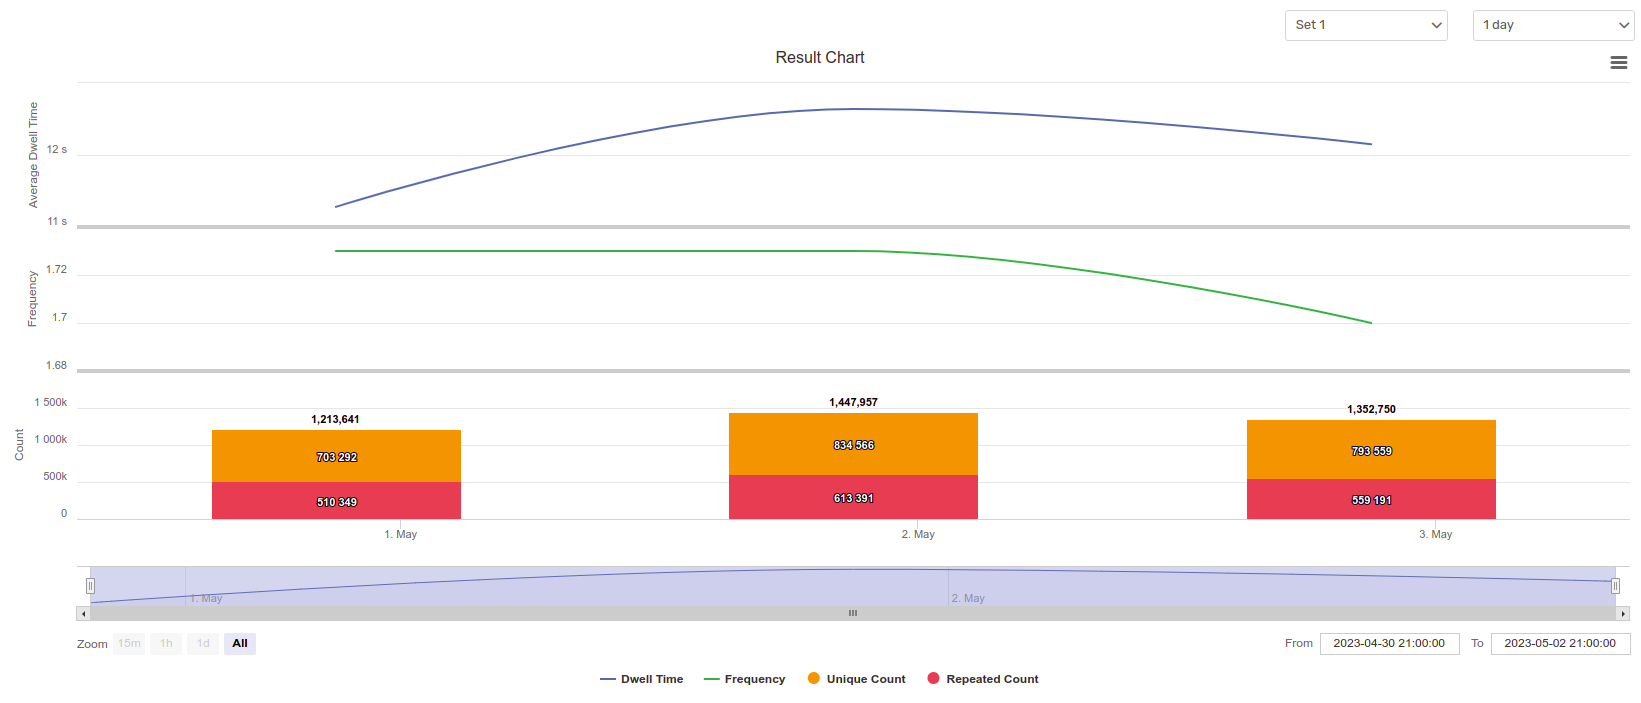
Below these charts, you can zoom into your desired time interval to have a closer look at the charts.

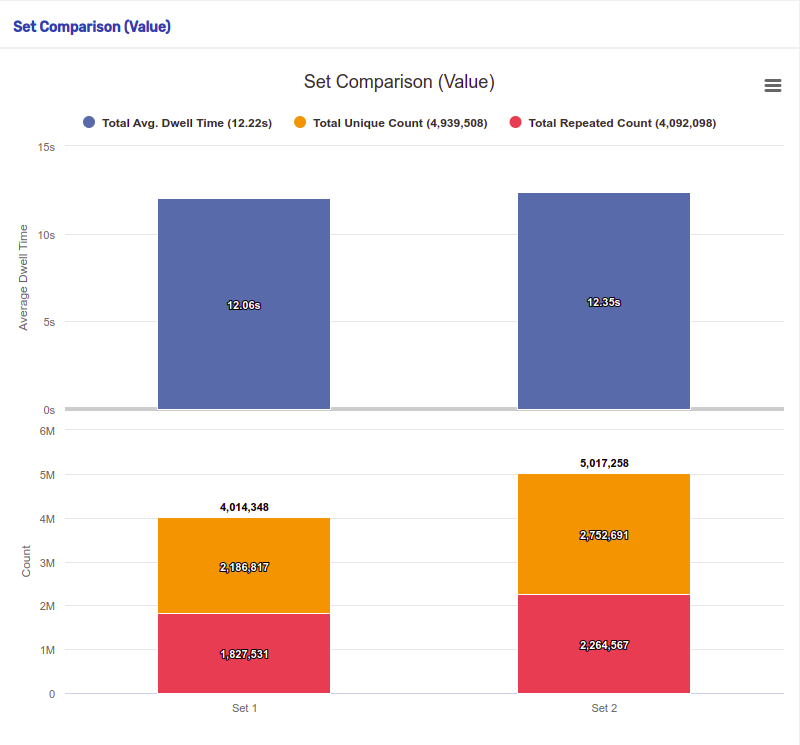
Set Comparison (Value)
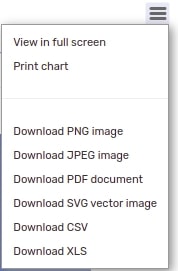
Here you can compare your different sets with the Average Dwell Time and Total Count statistics. You can also click on the hamburger menu to view the chart in full screen, print it, or export it in your desired file type.
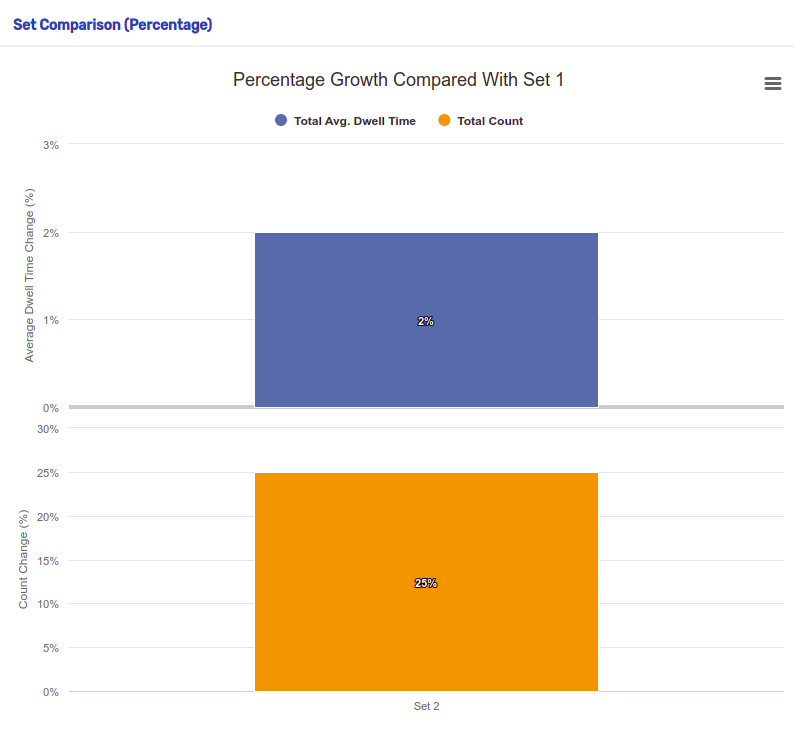
Set Comparison (Percentage)
With this chart, you can compare the percentage growth of different sets for the Average Dwell Time Change and Count Change with Set 1 (reference set).
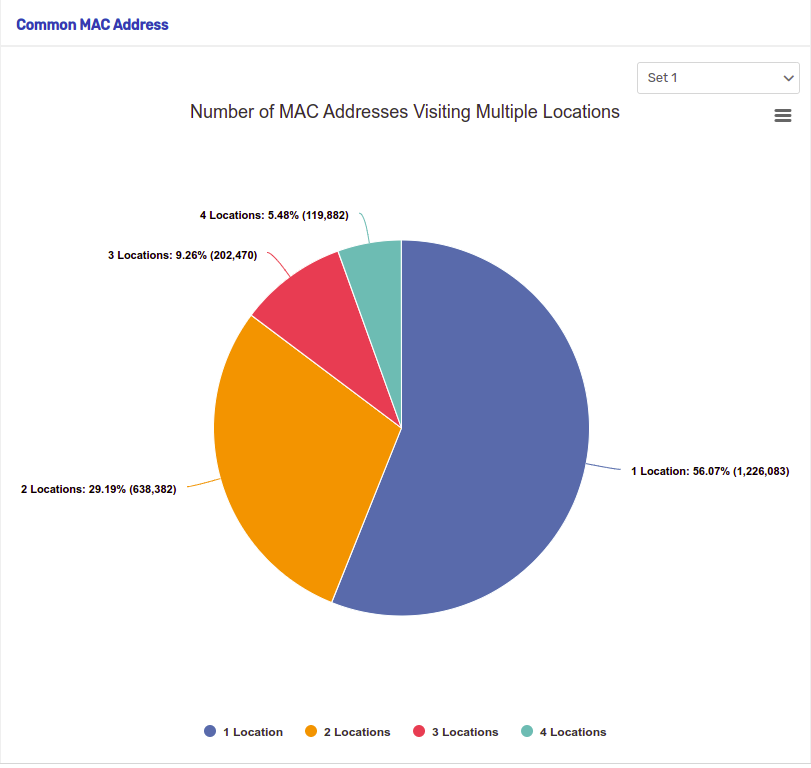
Common MAC Address
This chart shows the count and percentages of MAC Addresses that have visited multiple locations for the selected set.