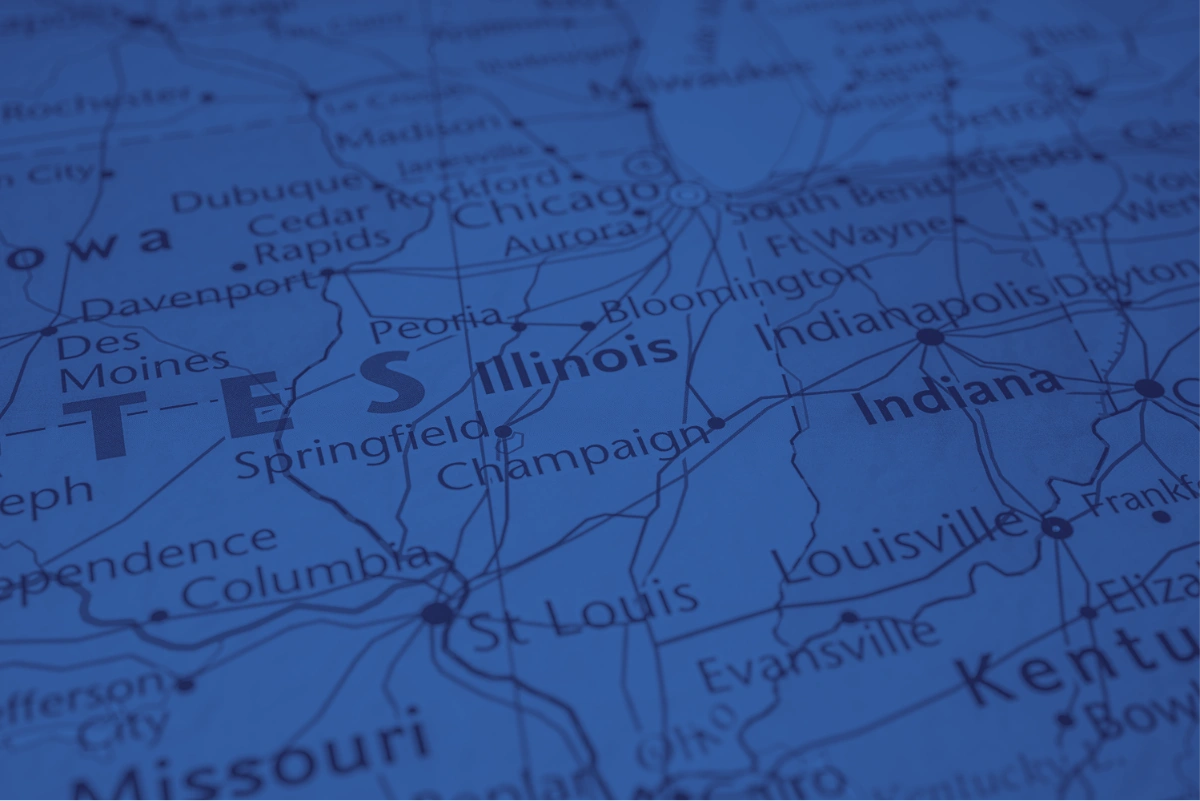
5 ways high resolution Connected Car Data is changing traffic analytics
High resolution connected car data can provide advanced, accurate traffic data analytics. With high coverage, low data latency, increased accuracy, ease of access, and quality data, connected cars are changing data analytics.
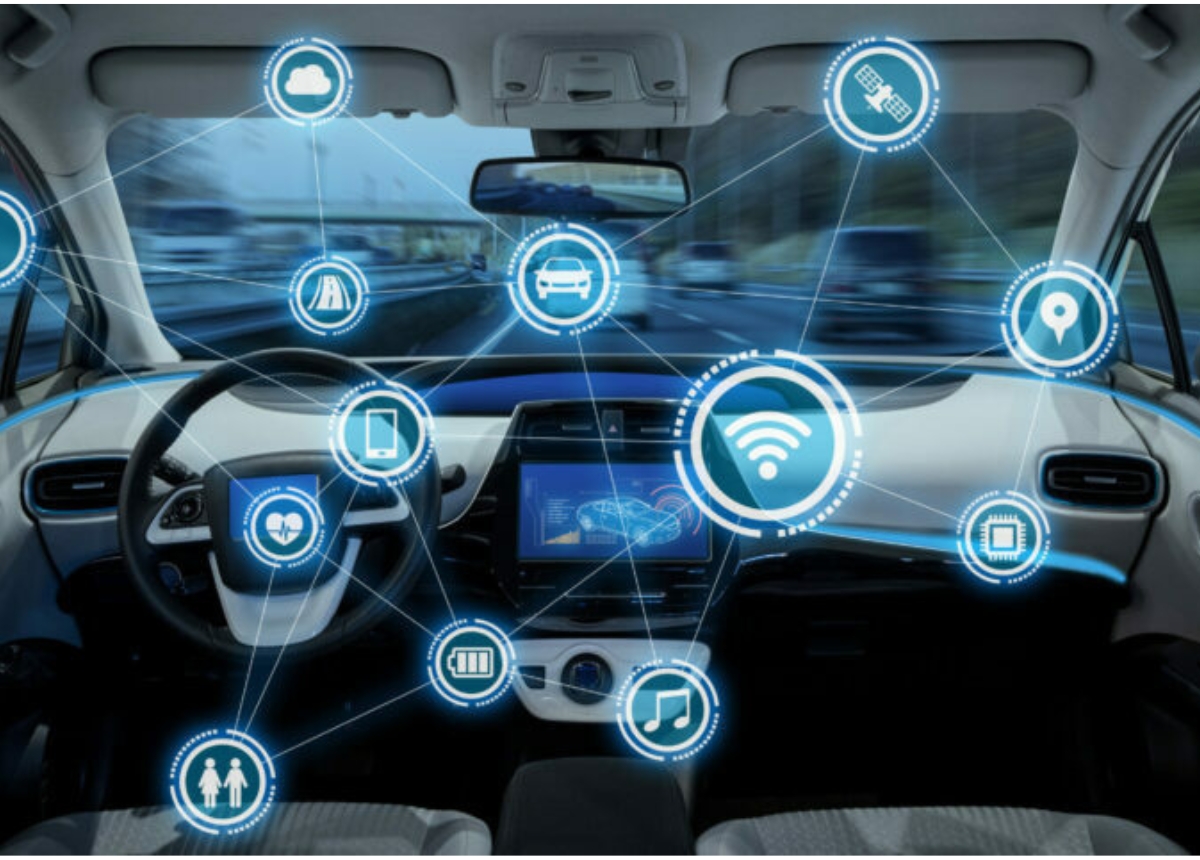
Vehicle technology is ever advancing, and cars are now more connected than ever before. A high resolution connected car (HRCC) uses IoT technology, where wireless networks allow vehicles to communicate bi-directionally with other vehicles or infrastructure. This communication allows vehicles to share information regarding their location, speed, and other parameters in real-time with the manufacturer. Mobility intelligence companies can provide advanced traffic data analytics by utilizing connected car data. Here are 5 ways HRCC data can provide more accurate, well-rounded traffic and journey analytics.
1. High coverage
Connected car data doesn’t rely on potentially spotty networks or sensor data. Companies like Wejo, who utilize HRCC data, have coverage of 95% of roads in the United States, including rural roads. This gives them increased access to traveler data and route information. Wejo, with 10.7 million active vehicles and 9.1 trillion data points, can access complete data across greater and more complex journey lengths than mobile applications data or sensors.
2. Quality data
HRCC data provides a wealth of useful insights with precise data. Connected cars transmit data every 3 seconds to Wejo, and data can reach customers in under 32 seconds. Since data is being taken straight from the car, companies have increased data access, and can collect data such as movements and journey data, current/historical driving behaviors, harsh braking, occupancy counts, queue lengths, congestion levels, and weather conditions. Where location-based service apps can provide full-trip origin-destination studies, HRCC data can provide exact information for full and partial trip origin-destination studies, as well as exact speeds and travel times within road segments. Overall, HRCC data provides more complete journey analysis and allows for full-picture analysis of driving patterns and preferences.
3. Low data latency
Location based service apps may take minutes or hours to update depending on frequency, with an update latency of 6 hours. In comparison, high frequency, HRCC data transmits every 1-5 seconds, with update latency ranging from 15-60 seconds. This makes it easy to track traffic patterns, such as congestion, in real-time.
4. Increased accuracy
Data collected from mobile phones is typically accurate to around 4.9 meters, making mobile data subject to accidentally picking up pedestrian or bus passenger data in slow moving or congested zones. HRCC data comes from a single vehicle, with the average car able to produce up to 30 terabytes of data every day. Using this high-resolution data, Wejo is able to claim data precision of under 3 meters 95% of the time. This means that data will accurately reflect vehicles without interference from other traffic.
5. Ease of access
HRCC data can be accessed using cloud-based data exchange platforms, meaning no hardware installation is required, and data streams directly to the cloud or an API. Data collection companies make sure data is anonymous and designed to follow all privacy laws and legislation. HRCC data companies break down high volumes of data to provide relevant, easy to understand, quality data at high processing speeds.
High resolution connected car data can provide insight on traffic patterns, detours, route preferences, and every step of the driver’s journey from point A to B. While location-based service apps and crowdsourced data can provide valuable insight, HRCC data is able to analyze every step of the process to create a robust analysis of journey data and driver preferences.
Utilizing connected car data from companies like Wejo, SMATS' iNode provides ready-to-use metrics, insights and visuals for holistic and dynamic data analysis.