13 actionable ATSPMs
An introduction to 13 common ATSPMs and how they can benefit agencies. Cut costs, reduce travel time, and improve safety!
Automated traffic signal performance measures (ATSPMs) are visual reports and actionable performance measures generated through the automatic collection of high-resolution traffic detection data. The data is sent to a centralized location, allowing agencies to improve safety and customer service while actively managing their signal performance. Data is collected 24 hours a day, allowing agencies to make informed decisions and divert resources based on need and urgency.
ATSPMs utilize existing infrastructure, and can be used alone or alongside other measures. A Transportation Pooled Fund study, led by the Indiana DOT, produced an open source software option that agencies can access through the FHWA Open Source Application Data Portal (OSADP). Unlike some vendor options, this software can process data from any Linux-based controller. Here, we examine 13 common ATSPMs that can be accessed from the open source code option.
13 common ATSPMs
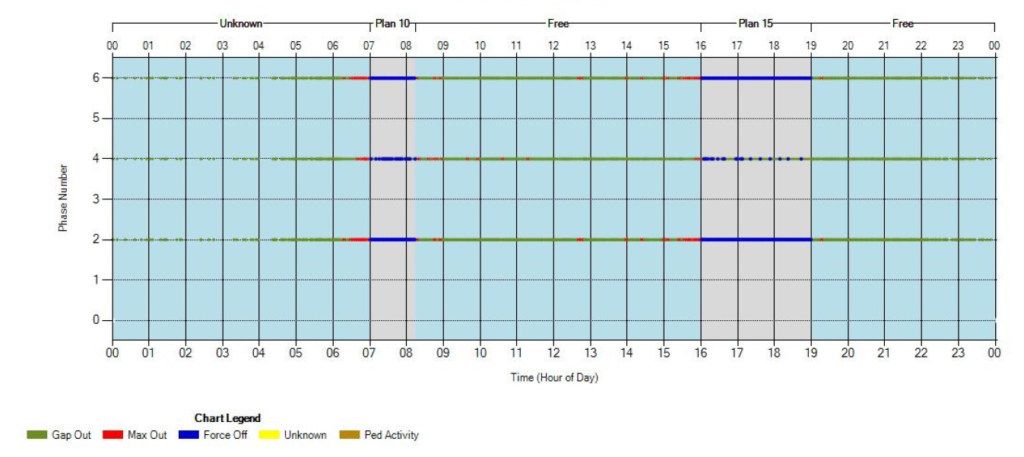
1. Purdue phase termination
Purdue Phase Termination reports the reason for phase termination during a specified cycle and time period. Reasons for termination include:
- Gap out: the phase is terminated by the signal controller because the minimum time has been served, there was a conflicting call, and the vehicle extension timer expired.
- Max out: there is enough traffic to extend the phase to its maximum time.
- Force off: there is enough time to extend the phase to its force-off point. This is similar to max out, but involves the timing of a coordinated plan.
- Skip: there is no call, resulting in a phase being skipped.
- Pedestrian activity: the termination point for pedestrian phases.
Detection: Stop bar detection.
Applications: Purdue Phase Termination can be used to estimate available intersection capacity, identify detector failures, verify the programming of signal timing parameters, and assess actuated phases.
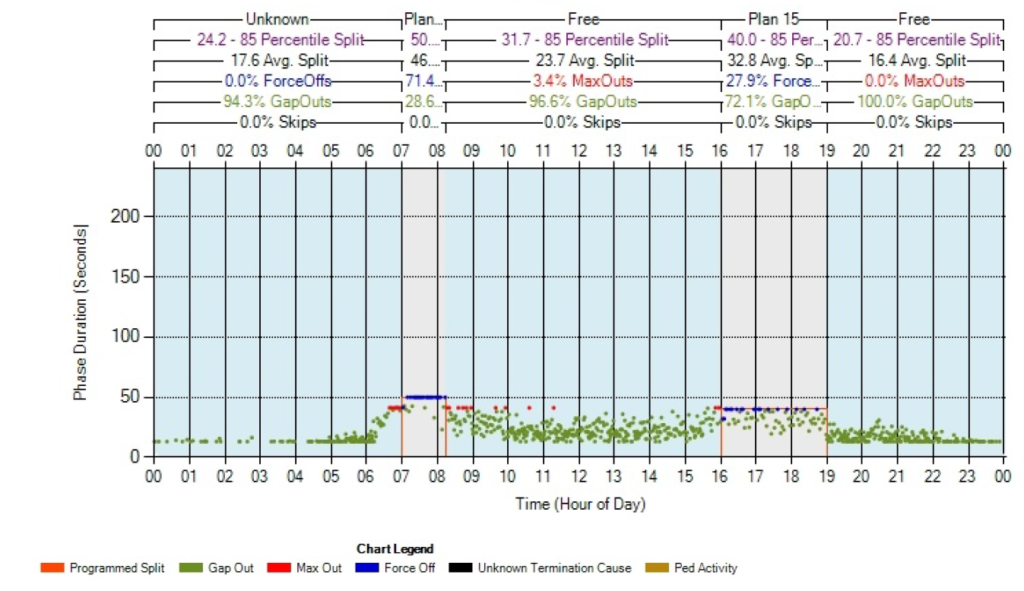
2. Split monitor
Similar to Purdue Phase Termination, Split Monitor reports phase termination information, and combines it with information about split duration and programmed splits. Unlike Purdue Phase Termination, Split Monitor reports have separate charts per phase, providing more detailed information. Used together, Purdue Phase Termination reports can identify phases which may need capacity adjustment, and Split Monitor reports can provide richer information on how often a phase terminates and how much capacity is available.
Detection: Stop bar detection.
Applications: Split Monitor can be used to estimate required and available green time by phase, and verify the programming of signal timing parameters.
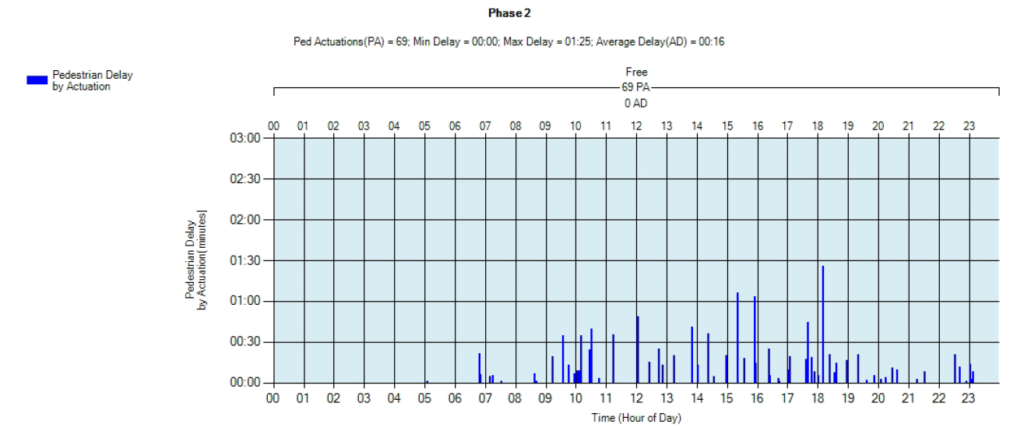
3. Pedestrian delay
Pedestrian Delay reports the wait time for pedestrians after pushing the Walk button, and how frequently pedestrians are requesting the Walk signal. The report summarizes this information by phase for every specific cycle and time period.
Detection: Pedestrian push buttons.
Applications: Pedestrian Delay can identify intersections with high pedestrian delay, identify failures in push buttons, and evaluate if operation changes reduced delay.
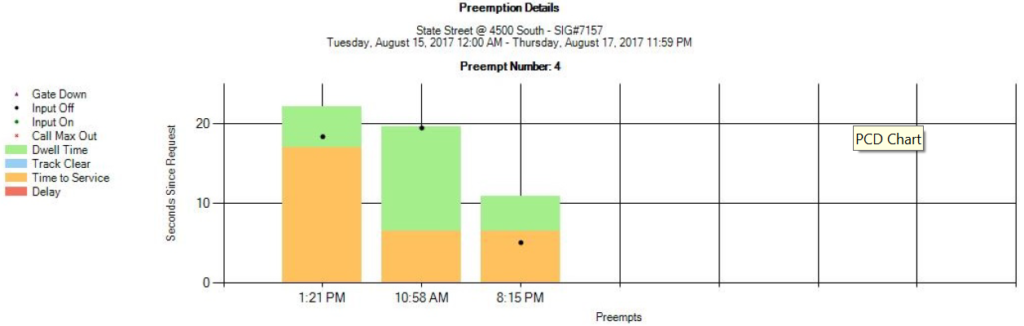
4. Preemption details
Preemption Details can be used at intersections where signals are configured to allow certain vehicles, such as emergency vehicles or trains, to preempt normal operations. A report will include information on: preemption request times, preemption service times, and preemption details.
Detection: Signals must be set up for preemption.
Applications: Preemption Details can identify intersections that have a high number of preemption events and how often they are being preempted, and can identify intersections where preemption events are increasing delay for other
5. Purdue Coordination Diagram (PCD)
Preemption Details can be used at intersections where signals are configured to allow certain vehicles, such as emergency vehicles or trains, to preempt normal operations. A report will include information on: preemption request times, preemption service times, and preemption details.
Detection: Signals must be set up for preemption.
Applications: Preemption Details can identify intersections that have a high number of preemption events and how often they are being preempted, and can identify intersections where preemption events are increasing delay for other
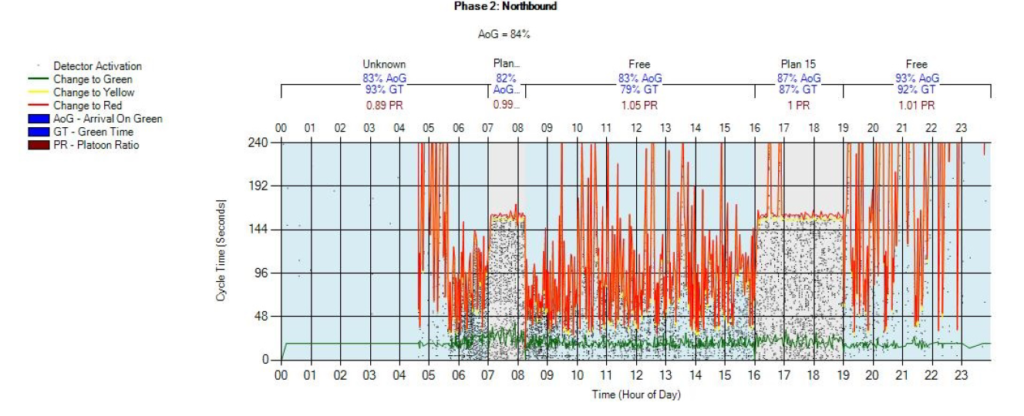
6. Purdue link pivot
Purdue Link Pivot can evaluate multiple signals along a coordinated corridor, and uses predicted arrivals on green to optimize offsets. The report recommends possible offset adjustments using different categories, and provides a comparison between existing arrivals on green and predicted arrivals on green.
Detection: Advance detection required. In addition to advance vehicle detection, Link Pivot Routes, analysis time period, and cycle length will have to be programmed.
Applications: The Purdue Link Pivot can use arrivals on green to identify offset adjustments, and evaluate if there is increased arrival on green after signal timing adjustments are made.

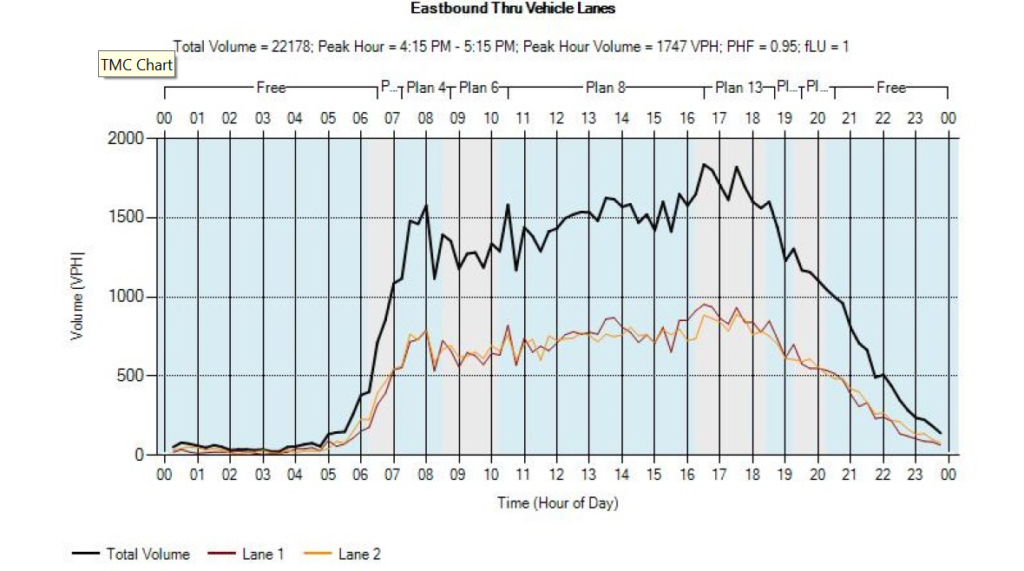
7. Turning movement counts
Turning Movement Counts provide reports on vehicle volumes by lane, and the volume sum for each lane group. Bicycle volume can be added if bicycle detection exists. Reports can display volumes by specified time intervals.
Detection: Stop bar counts are required. Lane-by-lane detection is needed for accuracy, and detection zones should be small. Detection zones past the stop bar will be the most accurate.
Applications: Turning Movement Counts can estimate available capacity per phase, and determine how many vehicles are passing through an intersection, and how those vehicles are moving.
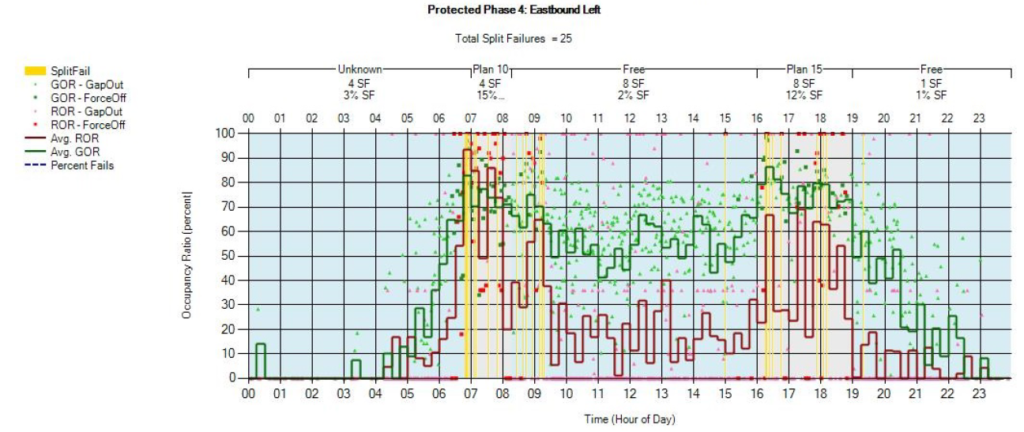
8. Purdue split failure
Purdue Split Failure reports how often vehicles are unable to go through an intersection during a single phase, which impacts driver delay. When Green Occupancy Ratios and Red Occupancy Ratios, which report the phase percentage where a stop bar is occupied during either interval, are above 80%, a split failure is recorded.
Detection: Stop bar counts are required. While having a stop bar detector in all lanes is recommended, other reports, such as Purdue Phase Termination, can provide greater insight.
Applications: Purdue Split Failure can estimate how much green time is available or needed by phase, identify intersections and times where there are split failures, and determine if there are fewer split failures after signal timing adjustments.
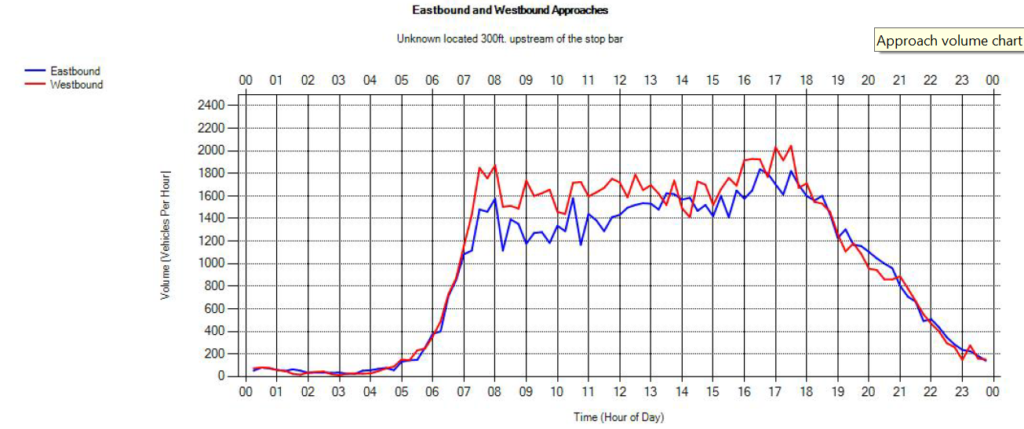
9. Approach volume
Approach Volume reports vehicle volumes for direction pairs (e.g., north/south) according to specified time intervals, usually 15 minutes. Planning-level metrics are also provided, including D values, K values, and peak hour factors.
Detection: Advance detection required. Count detection is required, and detection zones should be small. Lane-by-lane detection is the most accurate.
Applications: Approach Volume can identify intersections that have high vehicle volumes, evaluate time-of-day plans, estimate capacity availability, and gain insight on vehicle movements during special events or circumstances
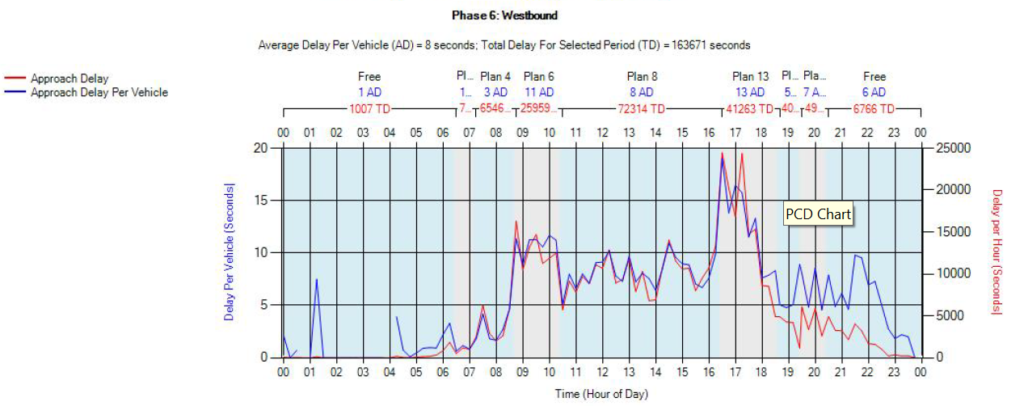
10. Approach delay
Approach Delay reports how long vehicles wait at an intersection before they get a green light. For each phase, it reports total delay and average delay per vehicle.
Detection: Advance detection and stop bars required. Detection should be around 350-400 feet from the stop bar, and detection zones should be small.
Applications: Approach Delay can identify intersections where there is high vehicle delay, and determine if there is reduced delay after signal timing adjustments.
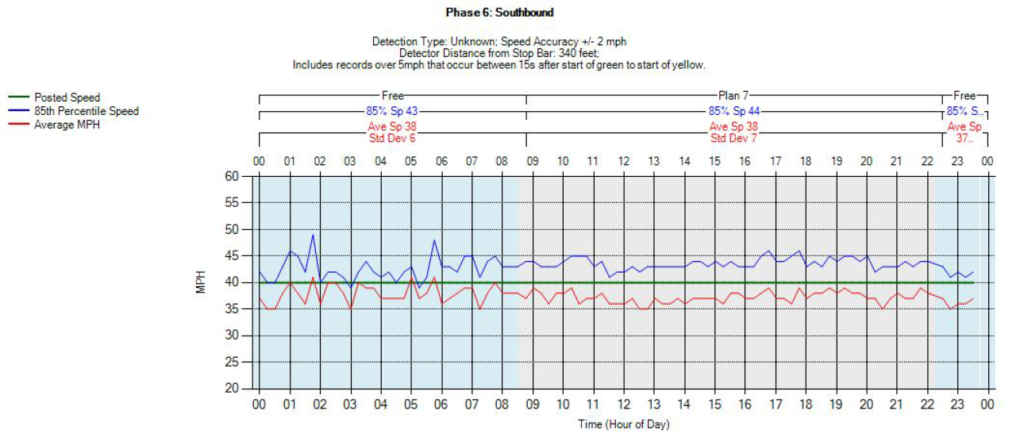
11. Approach speed
Approach Speed reports the average speeds, the speed limit, and 85th percentile speeds, allowing for time-of-day speed change assessments.
Detection: Speed detector required, such as Wifi and Bluetooth sensors.
Applications: Approach speed can identify intersections and times where traffic speeds are higher or lower, adjust signal timing parameters, and identify intersections which may be a safety risk.
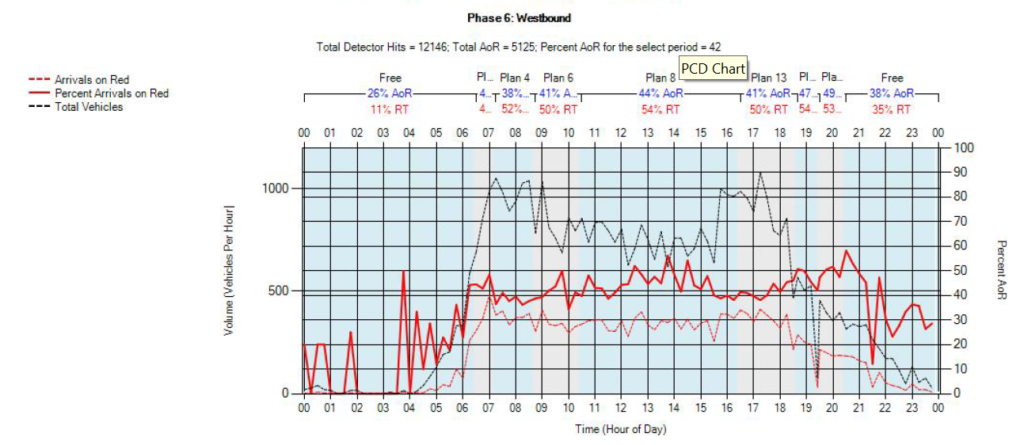
12. Arrivals on red
Unlike Purdue Coordination Diagram, Arrivals on Red reports only the number or percentage of vehicles arriving at an intersection during red lights. Arrivals on Red does not report when the vehicles arrived at the intersection.
Detection: Advance detection required. Detection should be around 350-400 feet from the stop bar, and detection zones should be small.
Applications: Arrivals on Red can identify intersections and times-of-day when there is a higher percentage of vehicles arriving on red, and determine if fewer vehicles arrive on red after signal timing adjustments.
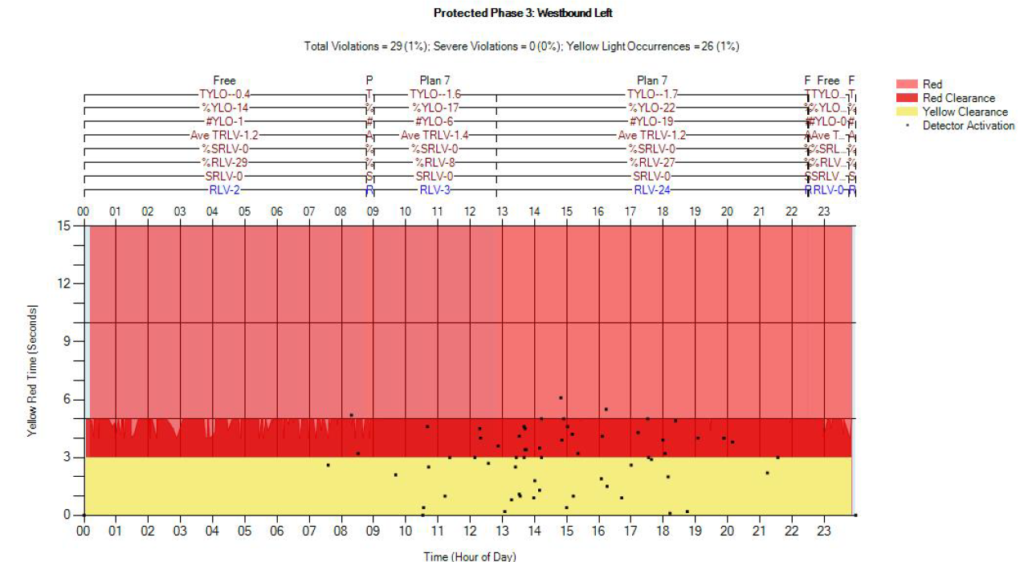
13. Yellow and red actuations
Yellow and Red Actuations report vehicles entering an intersection when the signal is yellow or red. The report can display where in the yellow or red interval the vehicle entered the intersection.
Detection: Stop bar counts are required. Detection zones should be placed past the stop bar, or at the stop bar if they can filter out stopping vehicles. Detection zones should be small.
Applications: Yellow and Red Actuations can identify intersections or phases where there are high volumes of vehicles running red lights, and determine if there are fewer violations after signal timing adjustments.
How agencies utilize ATSPMs will vary depending on resources and current detection measures, but research shows that ATSPMs can provide a variety of benefits. For agencies, signals can be monitored and adjusted remotely, there are savings in maintenance costs and resources, and existing technology can be utilized. For drivers, ATSPMs increase safety, and a reduction of travel and wait times. ATSPMs, however they’re used, can increase the efficiency and maintenance of traffic signal systems!
Utilizing high resolution connected car data, SMATS' iNode can generate accurate ATSPMs such as Arrival on Green percentage, Split Failure percentage and many more.