
Connected Car Data: the next generation of surrogate safety analytics
See how connected car data can provide the next generation of surrogate safety analytics for road segments and intersections.
When an intersection sees a high frequency of hard braking, or a road section sees high volumes of vehicle speeding, one might think that it’s a high–risk area for road safety and proactive measures should be implemented to prevent crashes from occurring. Proving the intuition with data, however, hasn’t been easy.
Data such as hard braking or speeding – which was impossible to collect on scale a few years ago – are becoming available through connected car data and quickly being leveraged by innovative transportation agencies to identify safety “hot spots”, i.e., locations more prone to accidents. Such data can be collected for network-wide studies or for pinpointing a particular intersection or road segment, allowing road safety experts to investigate citizen complaints, prioritize projects, dig deeper into driver behaviours causing accidents, and design counter measures.
If your goals are to reduce crash frequency and crash severity, and to do it as early as possible, keep reading.
The rise of surrogate safety data
Collision data has long informed road safety analysis, but it is always delayed, requiring years of reported incidents.
Surrogate safety measures are non-crash measures, such as near misses that could have resulted in a crash, but fortunately did not. They are useful indicators for measuring the risk of crash occurrence by giving visibility into driver behaviour and patterns.
Because this data can be obtained faster, it enables safety experts to take a proactive approach to predicting accidents and take preventative actions more timely and efficiently.

Connected Car Data for safety studies
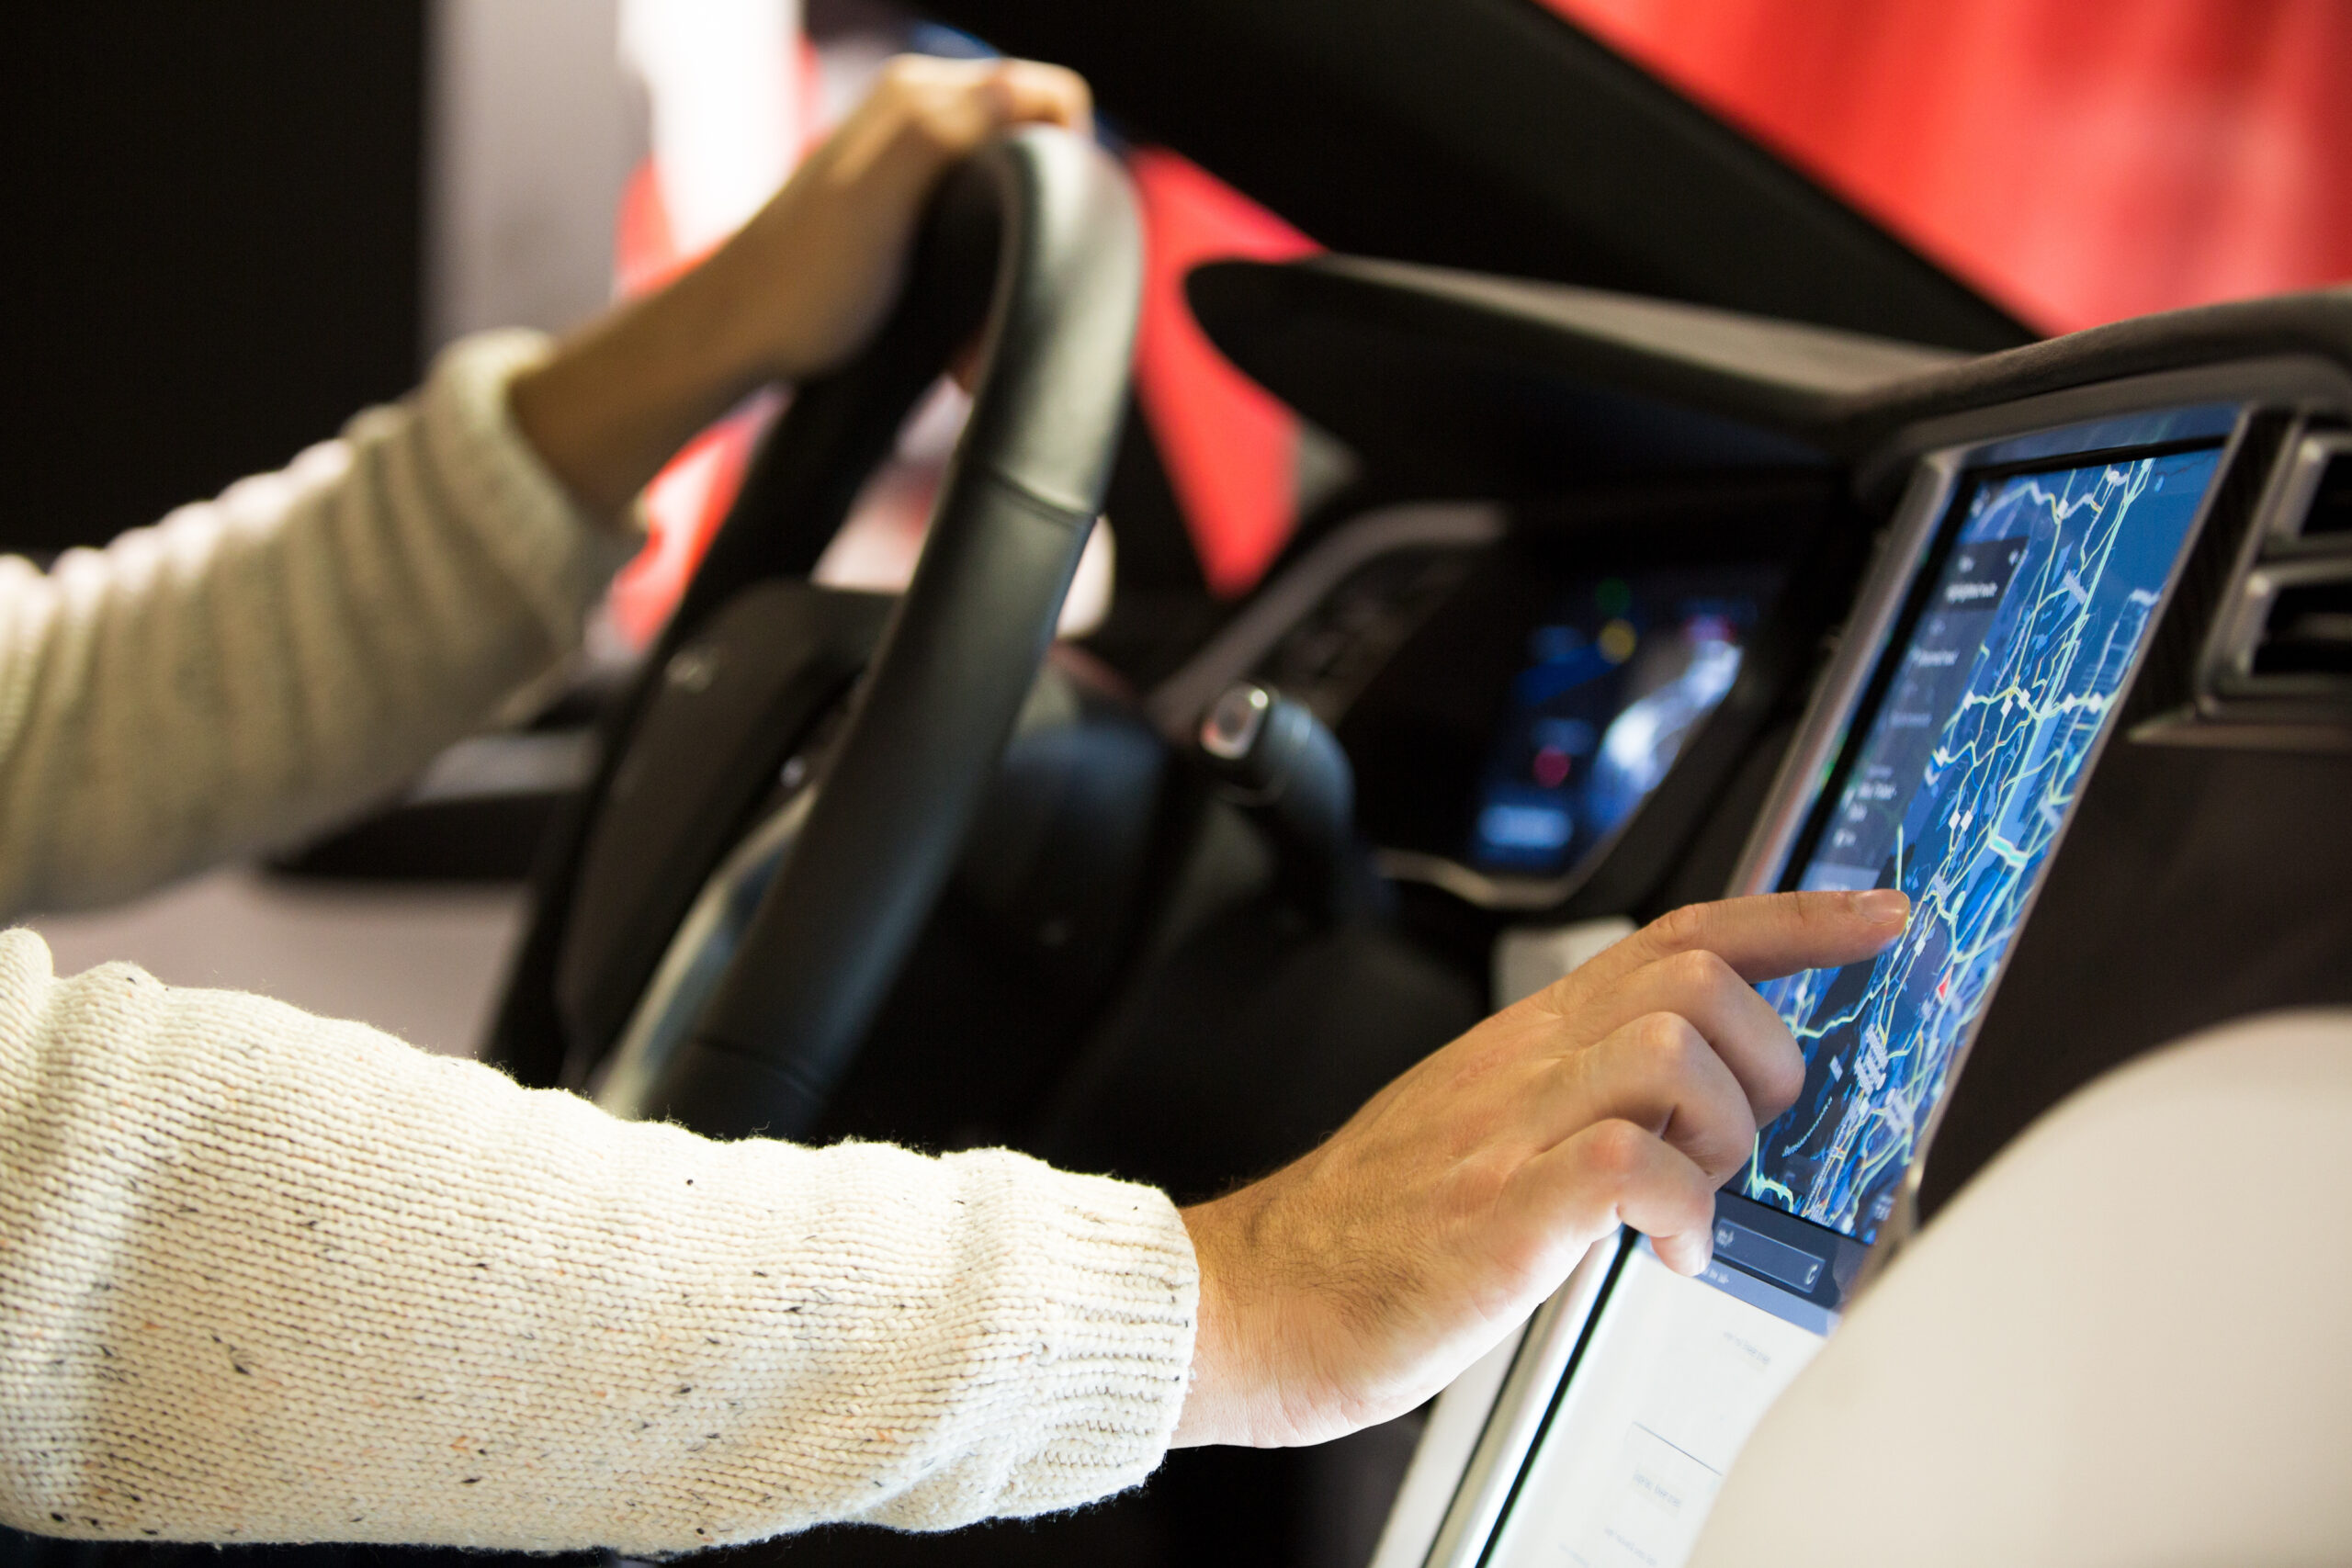
Connected car data refers to data generated by vehicles that are connected to the internet, such as harsh accelerations, harsh brakes, speed, seatbelt violations and more. As a form of surrogate data, connected car data offers the benefits, such as unparalleled visibility into driver behaviours, that traditional methods can’t for safety studies and risk screening modelling. Connected car data also offers network-wide coverage without using any roadside sensors, such as cameras or lidar, making it useful for studying large networks economically and efficiently.
Using driver behaviours for risk screening and accident prediction
How accurately can driver behaviours predict accidents though? And what driver behaviours are the most important for predicting accidents? We started by studying two common driver behaviours: harsh acceleration and deceleration.
Thanks to the high-resolution quality of connected car data, we can pinpoint these two driver behaviours to any intersection or road segment, as well as isolate the behavioral data based on their relationship with another vehicle or with a Vulnerable Road User.
Driver behaviours matter – a study
To analyze whether harsh accelerations and decelerations (which we call event data) can predict accidents accurately, and their ranked importance as predictors, we did a correlation study between historic crash counts and event data using the Spearman Correlation Analysis Methodology.
Spearman Rank Correlation is a non-parametric statistical method used to measure the strength and direction of the relationship between two ranked variables. In our case, variables are surrogate and traditional safety metrics such as average speed, number of crashes, and connected car event data.
The Spearman rank correlation coefficient ranges between -1 and 1. A value of -1 indicates a perfect negative correlation, e.g., when one variable (such as average speed) increases, the other variable (such as count of crashes) decreases. A value of 1 indicates a perfect positive correlation, e.g., when one variable increases (such as average speed), the other variable also increases (such as count of crashes). A value of 0 indicates no correlation between the two variables.
We used this methodology to observe if an increase in harsh accelerations correlated with the number of crashes to determine whether harsh accelerations can be a predictor of crashes.
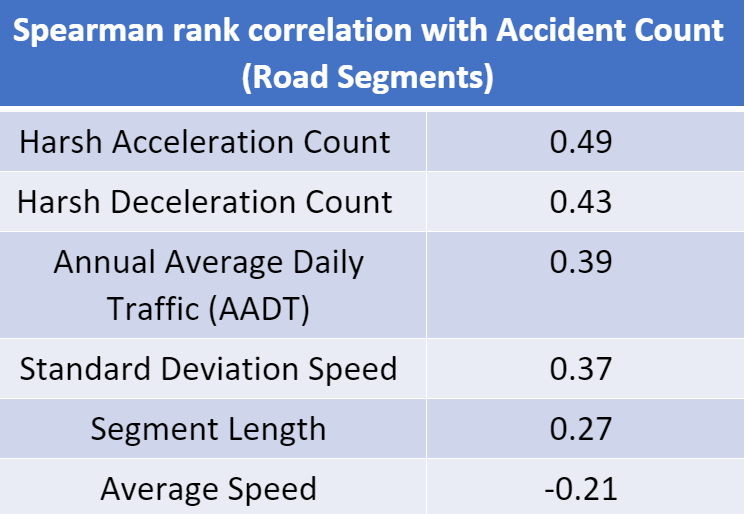
SMATS looked at accident data from 2015 to 2019 from the Washington State Department of Transportation’s (WSDOT) crash data portal for 1,710 road segments in Bellevue City. Driver behaviour data (such as harsh accelerations/decelerations), sourced through Wejo’s connected car database from January and February of 2020, were also analyzed.
We found that driver behaviours had a higher importance ranking than traditional variables (e.g., AADT) for predicting crashes. In fact, harsh acceleration was the most important variable for determining hotspots in road segments.
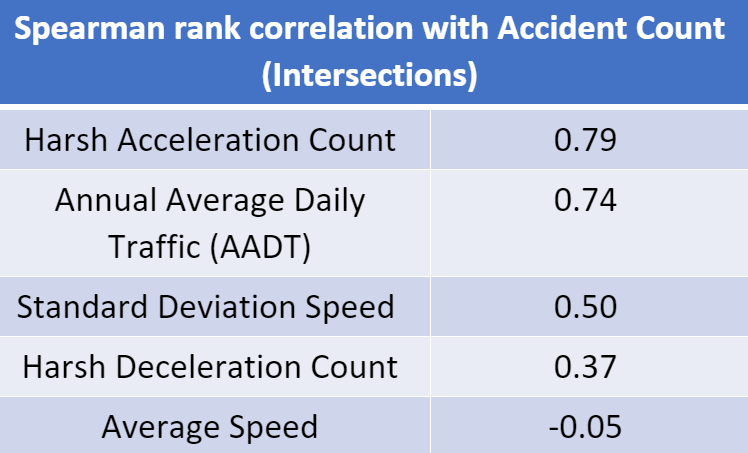
Using the same methodology, we analyzed the same driver behavioural data for the same period at 109 intersections in Bellevue City. The finding was consistent with the study of road segments. For intersections, harsh acceleration was also the most important variable for determining hotspots.

The takeaway: the next generation of risk screening models is here
The future of risk screening projects is faster, more efficient, and exciting!
Why do we say so?
- Driver behaviours can now be quantified using connected car event data.
- Connected car event data is highly correlated with historical crashes. Specifically, harsh acceleration and deceleration rank higher than AADT and speed in importance as accident predictors.
- Driver behaviours are proven significant crash predictors for both road segments and intersections.
Requiring no roadside sensors, connected car data is perfectly suited in next–generation risk screening models for large or small road networks to identify hotspots and assess project impact, saving time and cost.
Book a demo to check out our risk screening model using connected car data. It can be used as a standalone, or supplementary to SPF to improve prediction accuracy.
Connected car data is providing the next generation of safety analytics and hotspot identification, saving time and cost.