
Travel time reliability: how to measure and why it is important?
How to measure travel time reliability, and why it is important to do so, including a description of the main TTR components.at they remember due to unexpected delays. The following are the main components of travel time reliability.
We have all experienced traffic delays in our trips to home, work, or vacations. Although sometimes delays are expected ahead of time, and we can add extra time to our trip duration, unexpected delays can create serious problems for travelers, shippers, and businesses, making travel time reliability important to motorists. The unexpected delays can be caused by adverse weather conditions, road closures, or incidents.
Annual Average Travel Time is the measure that is used to report the roads’ traffic congestion. However, most of the time, it is different from what riders would experience every day or what they remember due to unexpected delays. So, what other measures should be reported along with average travel time as measures of congestion?
Travel Time Reliability (TTR) measures
Travel Time Reliability (TTR) measures help in calculating the unexpected delays. The following measures are the main components of TTR:
1. Travel Time Index (TTI):
Travel Time Index (TTI) is the ratio of Average Travel Time in peak hours to Free-Flow Travel Time. In other words, the Travel Time Index represents the average additional time required for a trip during peak times in comparison with that trip duration in no-traffic condition. For calculating Free-Flow Travel Time, divide the road length by maximum speed limit of the road.
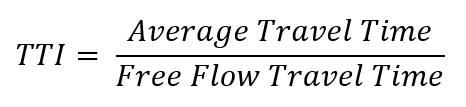
For instance, if the Average and Free-Flow Travel Time are 5 and 4 minutes, respectively, TTI would be 1.25. This value means that your trip will take 25% longer then no congestion condition. TTI can be calculated for different temporal grouping schemes such as X-minute intervals, by time-of-the-day, day-of-the-week, month, and for the entire year. Also, for each of these groups, TTI can be calculated for weekdays and weekends separately.
2. Buffer Index (BI):
Buffer Time is the additional time for unexpected delays that commuters should consider along with average travel time to be on-time 95 percent of the time. Buffer Index is calculating as follow:
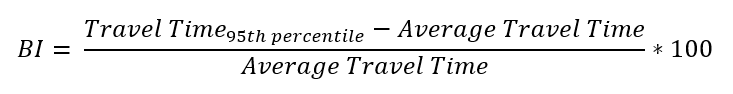
The buffer index is expressed as a percentage. For example, if BI and average travel time are 20% and 10 minutes, then the buffer time would be 2 minutes. Since it is calculated by 95th percentile travel time, it represents almost all worst-case delay scenarios and assures travelers to be on-time 95 percent of all trips.
3. Planning Time Index (PTI):
Planning Time Index is the ratio of the 95th percentile to the free-flow travel time and shows the total time which is needed for on-time arrival in 95 percent of all trips.
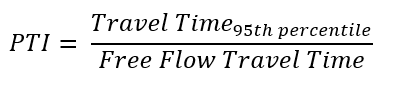
The difference between Buffer Index and Planning Time Index is that BI represents the extra delay time that should be added to average travel time, while the PTI indicates the total trip time (average travel time + buffer time). A PTI value of 2.0 for a given period suggests that travelers should spend twice as much time traveling as the free-flow travel time to reach their destination on-time 95 percent of the time. The planning time index is useful because it can be directly compared to the travel time index on similar numeric scales.
Different percentile values can be used instead of the 95th percentile. This value depends on your desired level of reliability. The lower percentile value results in lower reliability.
4. 90th or 95th percentile travel times
This measure is the most straightforward method that represents the travel time of the most congested day. Since this measure reports in minutes, it is easily understandable for drivers. However, the 90th or 95th Percentile measure can’t be used to compare different trips because of their various length. Also, it is hard to aggregate the trips travel time and report as subarea or citywide average.
5. Percentage of Travel under Congestion (PTC)
The percentage of travel under congestion is defined as the percentage of all vehicles’ miles traveled (VMT) under congested conditions in the specified duration. The PTC measure can be aggregated in the similar temporal fashion described above for TTI.
6. Frequency that congestion exceeds some expected threshold
This This measure shows the percent of days or times that the congestion exceeds some expected threshold. The threshold can be set on travel time or speed data, especially when you capture the traffic data 24/7. This measure is commonly reported on weekdays peak hours.
The following figure shows TTR Indices on a Travel Time Distribution chart from SMATS iNode:
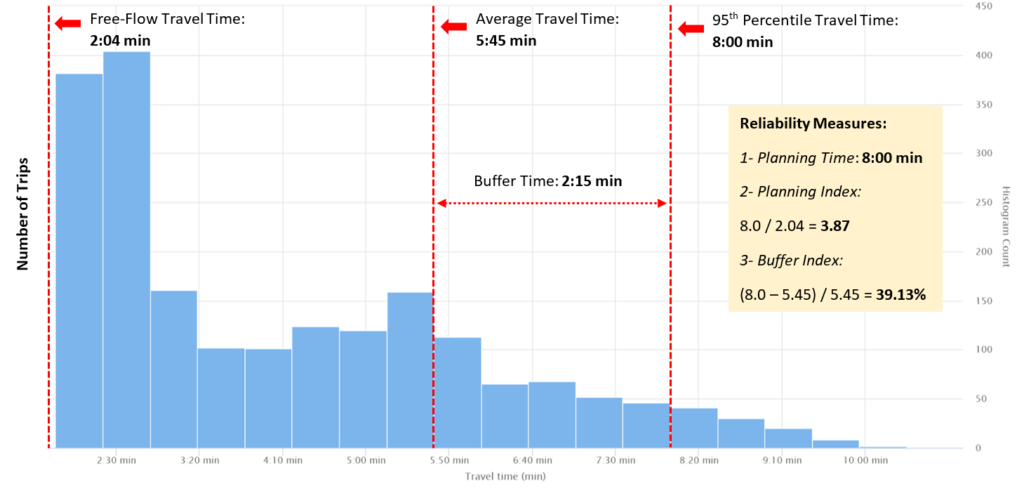
An example of Travel Time Distribution Chart in iNode
Source: U.S. Federal Highway Administration
Do these equations and methodologies seem overwhelming? SMATS’ iNode is designed to translate raw traffic data into ready-to-use performance metrics such as Travel Time Reliability (TTR) and much more.