Level of service: defining scores for different transportation facilities
A description of the different criteria used to assign LOS scores for different transportation facilities.
When measuring and interpreting the performance of a transportation facility, there are various users and stakeholders, such as motorists, pedestrians, community members, and agencies, who have different needs and expectations. Level of service scores can provide a quick, easy to understand analysis of how roadway users perceive the quality of service. While level of service scores should not be used alone to make decisions regarding transportation facilities, they are useful for understanding how decisions and changes will impact the way road users perceive the comfort and ease of their trip. The Highway Capacity Manual explains what levels of service are used for, and how service measures change depending on roadway, as summarized below:
What is level of service?
Level of service (LOS) does not offer the most in-depth or complex information, making it less than 100% accurate, but it is easy to translate and understand, allowing decision makers to determine general service quality and how likely any changes are to create perceived improvements for travelers. The letter grade system is familiar to most, and it provides a common system and set of definitions, allowing scores to be communicated easily to decision makers who lack technical knowledge. LOS makes communication easier and presents a simplified score for quick visualization.
How is level of service used?
LOS is scored separately for each transportation mode in a facility. Depending on mode of transport, travelers will have different experiences, and scoring them together would create an incomplete picture of how that facility is experienced, though certain transport modes may matter more or less depending on the roadway. This method of scoring also contributes to multimodal initiatives, where cities are trying to create favorable conditions for all travelers, not just motorists, in order to encourage alternative modes of transportation. Ultimately, LOS scores should not be the only factor taken into consideration when considering future changes, but it can offer a helpful overview.
Defining level of service for different facilities
Freeway and multilane highways
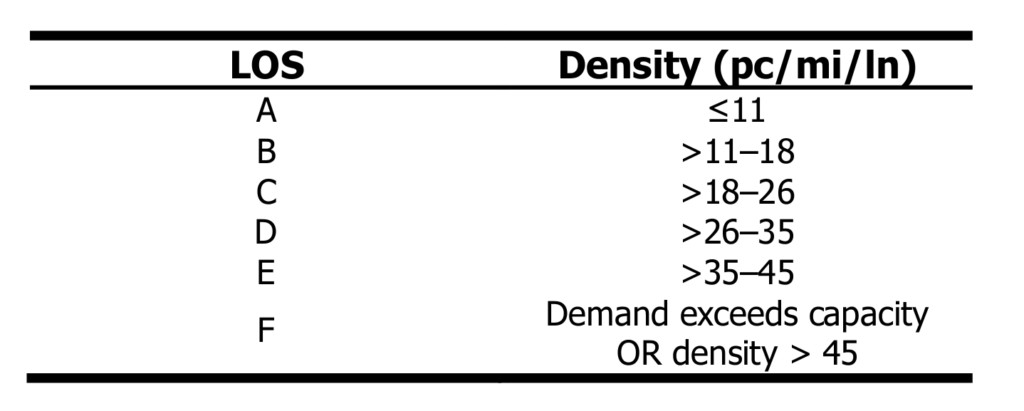
When defining LOS for basic freeway and multilane highways, the primary consideration is density. While speed is an important consideration, density is a larger indicator of vehicle mobility, and is more sensitive to changes in volume and flow rates. The three main performance measures are: density in cars per mile per lane, space mean speed, and the demand flow rate to capacity ratio. LOS scores are defined as:
LOS A: Unimpeded free-flow speed (FFS) with vehicles able to maneuver with almost no obstruction. Any negative incidents or conditions do not impact motorists.
LOS B: FFS is maintained, and motorists are only slightly restricted from being able to maneuver between lanes. There is high comfort for drivers and limited impact from minor incidents.
LOS C: Driver speeds are near the FFS, and maneuvering requires driver focus and care. Negative conditions regarding service quality will impact drivers, and any significant blockages or incidents are likely to cause queues.
LOS D: Density increases faster, and speed begins to decline. There is limited ability for drivers to maneuver, and drivers experience reduced comfort. Traffic is unable to absorb disruptions, and minor incidents will cause queueing.
LOS E: Traffic is operating at near capacity, and there is little to no room for drivers to maneuver between lanes. Any changes, such as merging vehicles, will cause upstream disruption. There is very little driver comfort, and any incident will cause a traffic breakdown and major queues.
LOS F: At this level, there is breakdown of traffic and unstable flow resulting from a bottleneck at a downstream point. This occurs when the ratio of demand to capacity exceeds 1.00. This can occur for reasons such as traffic incidents reducing capacity and points of congestion where more vehicles are entering than exiting.
Freeway merge and diverge segments
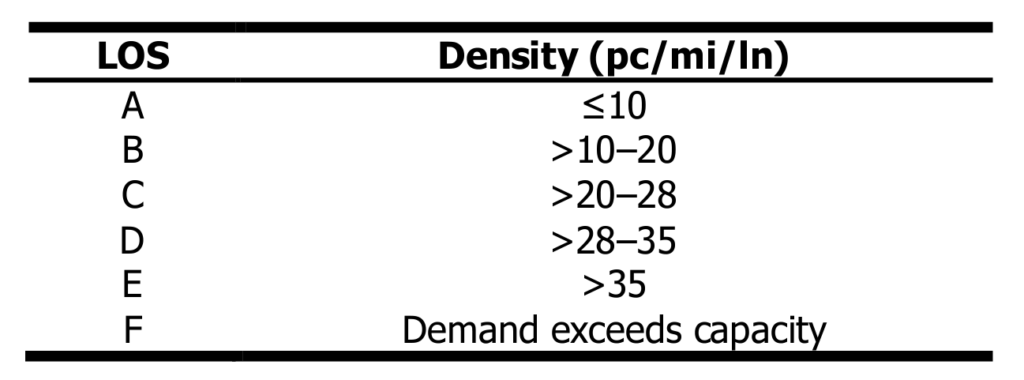
Similar to LOS scores for basic freeway and multi-lane highways, density is the primary consideration when scoring freeway merge and diverge segments. LOS scores are defined as:
LOS A: Operations are unrestricted, and merging or diverging is smooth with little disruption.
LOS B: Minimal disruptions occur, merging and diverging is noticeable to through drivers.
LOS C: Traffic is somewhat disrupted, and drivers on both the ramps and freeway need to adjust their speed to allow for merging and diverging.
LOS D: All vehicles need to slow for merging or diverging to occur, and queues may begin forming on high volume ramps.
LOS E: Operating conditions are near or at capacity, and minor changes in demand or traffic may cause queueing on both the ramp and freeway.
LOS F: Demand exceeds capacity, and queues form on both the ramp and freeway.
Two-lane highways
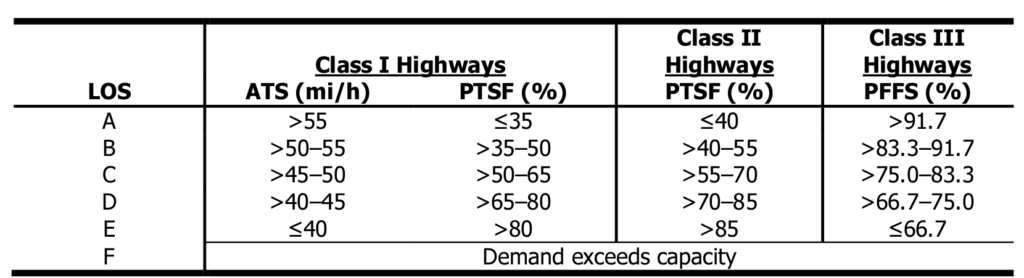
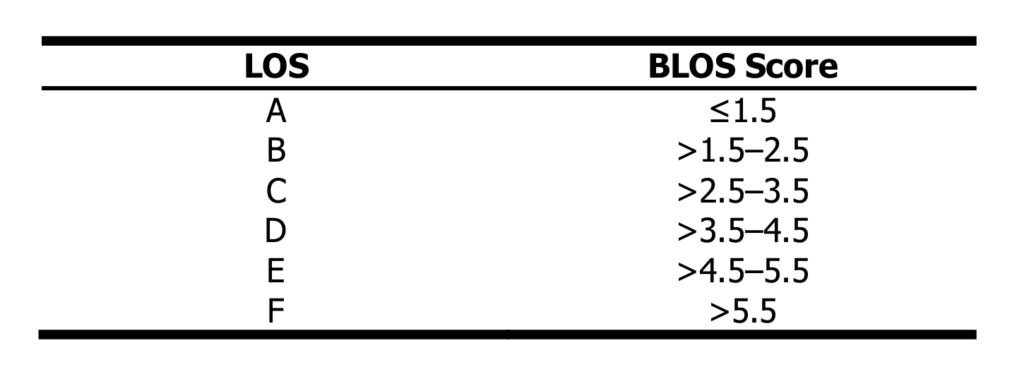
Two-lane highways differ greatly from multi-lane highways, because drivers are more limited in their mobility and speed. Any additional cars on the road can have significant impacts on traffic. For motorized vehicles, the three service measures used to determine LOS are: average travel speed (highway segment length divided by average travel time), percent time spent following (average time spent in groups behind slow vehicles), and percent of free-flow speed. On two-lane highways, there is also a bicycle LOS (BLOS) score, based on traveler perception. There are 5 considerations to the BLOS score: average effective width of the outside through lane, vehicle volumes, vehicle speeds, heavy vehicle volumes, and pavement conditions. LOS scores for motorized vehicles are defined as:
LOS A: High operating speeds at or near the FFS. Platooning is limited or unlikely, and motorists can pass easily.
LOS B: There is a balance between passing demand and capacity, and vehicle platooning occurs. There are small speed reductions.
LOS C: Speeds are noticeably reduced, and platoons occur for most vehicles.
LOS D: There is increased speed reduction, and significant platooning. Passing demand is high, but capacity is severely restricted, increasing percent time spent following.
LOS E: Speed is greatly reduced, and demand is almost at capacity, making passing impossible. At the lower end of LOS E, roads hit capacity.
LOS F: This occurs when the demand in at least one direction exceeds capacity, creating heavy congestion.
Urban street segments
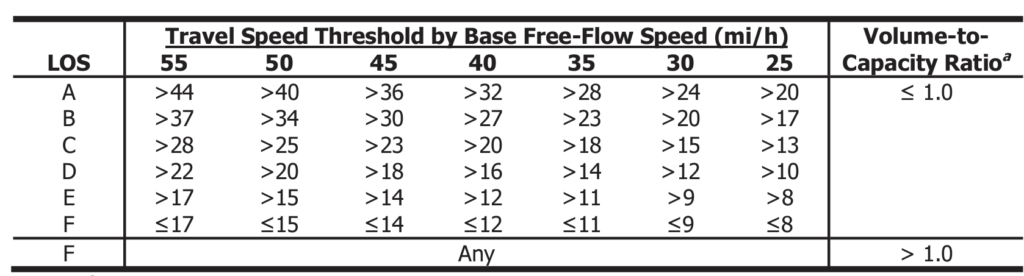
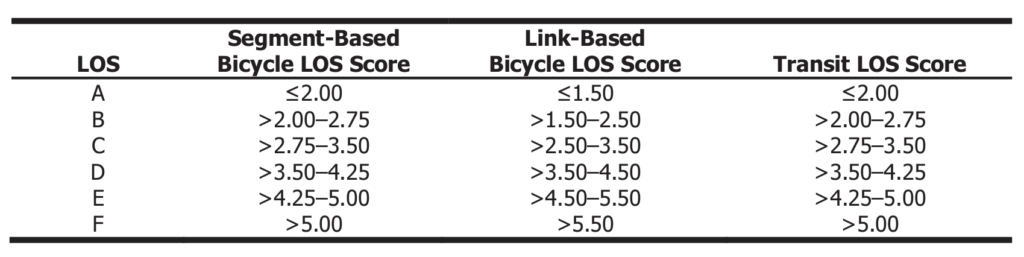
Level of service scores for urban street segments are determined for motorized vehicles, pedestrians, bicycles, and transit, with the LOS score for motorized vehicles having different criteria and being more easily measured. The performance measures for motorized vehicles are travel speed for through vehicles and volume-to-capacity ratio for downstream through movement. LOS scores for pedestrian, bicycle, and transit modes are usually based on traveler perception, and can be calculated for specific links or segments. LOS scores for motorized vehicles are defined as:
LOS A: Free flow operation with travel speeds exceeding 80% of the base free-flow speed. The volume-to-capacity ratio is not higher than 1.0, and there are no obstructions to maneuvering.
LOS B: Travel speed is between 67-80% of the base free-flow speed, and the volume-to-capacity ratio is not higher than 1.0. There are only slight restrictions for maneuvers.
LOS C: Travel speed is between 50-67% of the base free-flow speed, and the volume-to capacity ratio is not higher than 1.0. Longer queues at intersections may cause lower speeds. Maneuvers are more restricted than LOS B.
LOS D: Travel speed is between 40-50% of the base free-flow speed, and the volume-to-capacity ratio is not higher than 1.0. Any increase in flow will cause a significant decrease in travel speed and increased delay.
LOS E: Travel speed is between 30-40% of the base free-flow speed, and the volume-to-capacity ratio is no greater than 1.0. There is significant delay for motorists.
LOS F: Travel speed is 30% or less of the base free-flow speed, or the volume-to-capacity ratio is above 1.0. Traffic speed is extremely low, and there is high delay and queuing.
Signalized intersections
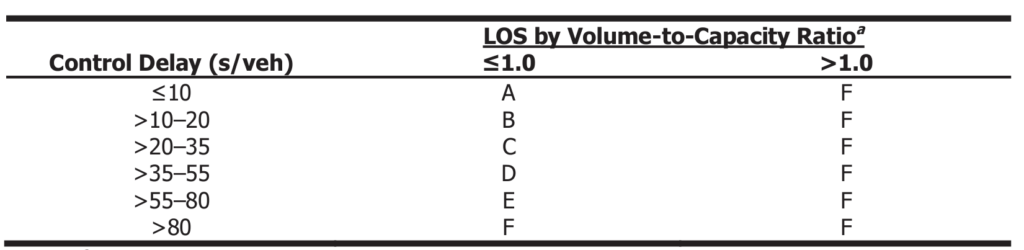
Signalized intersections have an LOS score for motorized vehicles, pedestrians, bicycles, and transit, with the LOS score for motorized vehicles having different criteria and being more easily measured. LOS can be determined for whole intersections, each intersection approach, and each lane group. For lane groups, control delay and volume-to-capacity ratio are the primary performance measures considered. LOS scores for pedestrian, bicycle, and transit modes are usually based on traveler perception, and can include factors such as speed and crosswalk width. LOS scores for motorized vehicles are defined as:
LOS A: Control delay no higher than 10 s/veh and a volume-to-capacity ratio no higher than 1.0. Typically assigned when progression at the intersection is exceptional with high arrival on green, or there is a very short cycle length.
LOS B: Control delay between 10 and 20 s/veh and a volume-to-capacity ratio no higher than 1.0. Typically assigned when there is exceptional progression at the intersection or there is a short cycle length. More vehicles have to stop than LOS A.
LOS C: Control delay between 20 and 35 s/veh and a volume-to-capacity ratio no higher than 1.0. Typically assigned when progression at the intersection is good or the cycle length is average. Many vehicles have to stop, and individual cycle failures may start to occur.
LOS D: Control delay between 35 and 55 s/veh and a volume-to-capacity ratio no higher than 1.0. Typically assigned when progression is not effective or there is a long cycle length. Many vehicles have to stop, and individual cycle failures happen more regularly.
LOS E: Control delay between 55 and 80 s/veh and a volume-to-capacity ratio no higher than 1.0. Typically assigned when progression is not ideal and there is a long cycle length. Individual cycle failures happen frequently.
LOS F: Control delay is over 80 s/veh or the volume-to-capacity ratio is higher than 1.0. Typically assigned when progression is very bad and there is a long cycle length. Most cycles are not able to clear the queue.
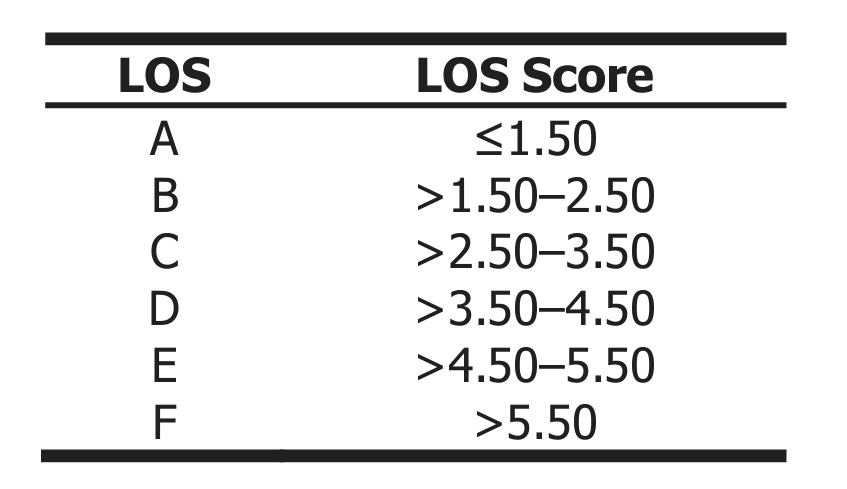
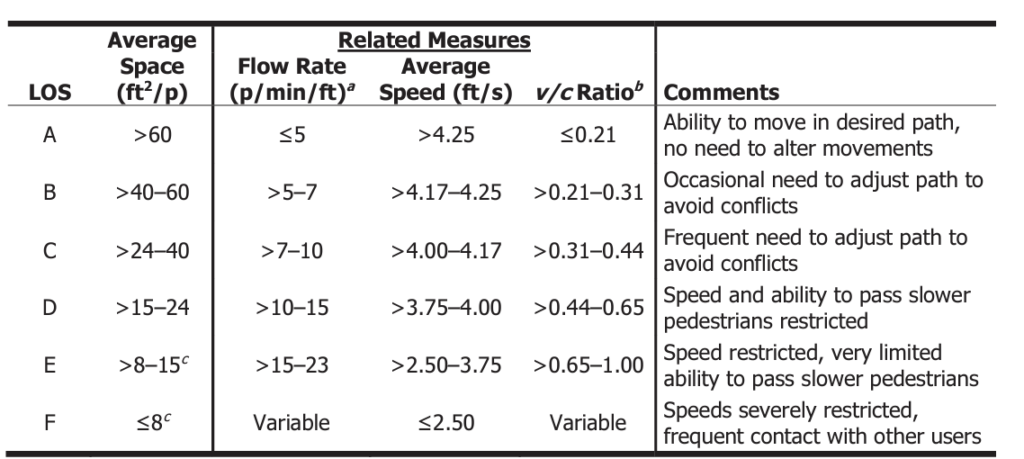
Off-street pedestrian and bicycle facilities
When determining LOS for on-street facilities, the pedestrian and bicyclist quality of service often reflects motorized traffic and how that traffic affects quality of service considerations, such as safety. When determining LOS for off-street facilities, three primary service measures include: pedestrian space (pedestrian only facilities), bicycle meeting and passing events per hour (pedestrian and bicycle facilities), and bicycle LOS (presence of bicyclists and road conditions for shared and exclusive bike paths). As cities move toward multimodal LOS scoring, pedestrian and bicycle considerations are becoming more important.
LOS scores use a common set of definitions and grading scale to allow for easy assessment of a roadway’s quality of service, allowing agencies and planners to determine whether changes will improve or decrease traveler’s perceived quality of service. Different roadways have different LOS criteria, and newer, multimodal approaches are straying from car-centric scoring to include alternative modes of transport.
Primary Source: Highway Capacity Manual, Sixth Edition: A Guide for Multimodal Mobility Analysis
Data collection methods, such as connected car trajectory data, available through SMATS, can create data that has been color-coded by LOS, making data analyzation efficient and consistent.