Manual studies, traffic sensors, and mobility data: An integrated approach to traffic data collection
Traffic data collection has evolved from manual studies and fixed sensors to large-scale mobility data, with each method offering different strengths and limitations. The most effective approach today is integrating these data sources to achieve more accurate, scalable, and comprehensive insights into transportation networks.
Traffic data collection has evolved significantly over the past several decades. What once primarily relied on field staff manually counting vehicles gradually expanded with the introduction of roadside detectors. Today, transportation agencies also draw on large-scale digital mobility datasets generated by connected vehicles, floating car data (FCD), location-based mobility signals from mobile devices, and cloud-based analytics platforms.
Each technological stage expanded how transportation systems could be measured. Early methods relied on human observation and simple counting tools. Fixed roadside detectors later enabled continuous monitoring at key locations. Modern mobility platforms now analyze large-scale location signals from vehicles and mobile devices to understand how people and goods move across entire transportation networks.
These new data environments also allow agencies to move beyond measuring vehicles alone. Today’s mobility datasets can provide insight into multimodal travel patterns, including driving, transit, freight movement, cycling, and walking. By combining several complementary data sources, agencies can build a more complete picture of mobility across corridors, cities, and regions.
The three stages of traffic data collection
Traffic data collection has evolved through three major stages: Manual traffic studies, sensor-based data collection, and network-scale mobility data. Each stage introduced new ways to measure and understand how transportation systems operate.
Stage one: Manual traffic studies
Early transportation studies often relied on teams of observers recording traffic flows throughout the day. In some cases, license plate surveys were conducted at multiple locations to estimate how vehicles moved through a city.
These methods remain widely used today for short-term studies, validation, and model calibration.
Common examples:
- Traffic counts
- License plate surveys
- GPS travel time runs
- Travel time surveys
What it can measure:
- Vehicle volumes
- pedestrian and cyclist counts
- Vehicle classifications
- Corridor and route travel times
- Basic origin-destination patterns (e.g., license plate surveys)
- Mode shares (distribution of trips by mode)
Modes it can measure:
- Passenger vehicles
- Fleet vehicles
- Public transit vehicles
- Cyclists
- Pedestrians
Key characteristics:
- Short study durations
- Labor-intensive field work
- Highly localized analysis
- Snapshot-style traffic data
Manual traffic studies provide accurate measurements for specific locations. However, they offer limited insight into how entire transportation networks behave over longer periods of time.
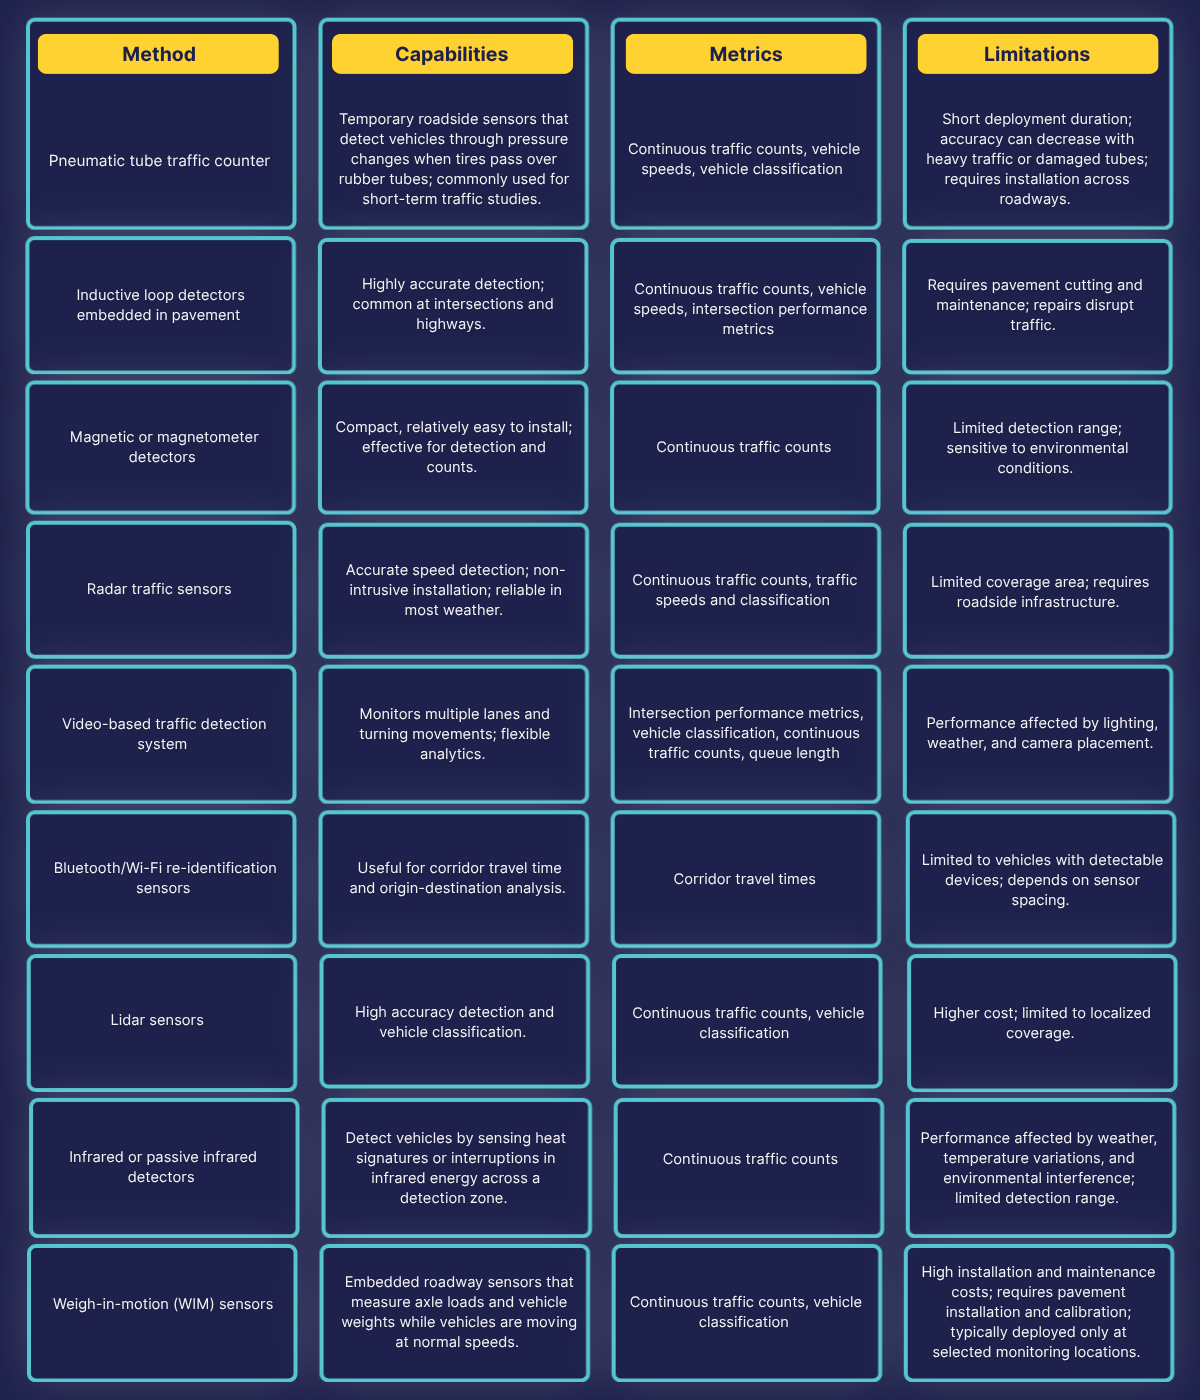
Stage two: Sensor-based data collection
As transportation systems expanded, agencies began installing temporary or permanent traffic sensors along roadways and intersections.
These hardware-based technologies continuously measure vehicle presence, speed, and traffic volumes at specific locations using a range of traffic sensor technologies deployed along corridors and intersections.
Common examples:
- Pneumatic tube traffic counters
- Inductive loop detectors embedded in pavement
- Magnetic or magnetometer detectors
- Radar traffic sensors
- Video-based traffic detection systems
- Bluetooth/Wi-Fi re-identification sensors
- Lidar traffic sensors
- Infrared or passive infrared detectors
- Weigh-in-motion (WIM) sensors
What it can measure:
- Continuous traffic volumes
- Vehicle speeds
- Corridor travel times
- Intersection performance metrics
- Vehicle classifications
- Queue lengths
Modes it can measure:
- Passenger vehicles
- Fleet vehicles
- Public transit
- Cyclists
- Pedestrians
Key characteristics:
- Continuous monitoring at fixed locations
- High accuracy for site-specific measurements
- Requires physical infrastructure installation
- Coverage limited to sensor locations
These technologies allow continuous monitoring at key locations such as intersections or freeway segments. However, each device still measures a single point in the network, meaning large sensor networks are often required to understand broader traffic patterns.
Stage three: Network-scale mobility data
The most recent stage in the evolution of traffic data collection is the emergence of network-scale mobility datasets, including probe data such as Floating Car Data (FCD) and location-based data. Instead of measuring traffic conditions at a single roadside sensor, these datasets observe movement across the transportation network by analyzing location signals generated as vehicles and travelers move through the system.
Floating car data, also referred to as probe data or connected vehicle data, is derived from anonymized GPS signals generated by connected vehicles, in-vehicle navigation systems, and fleet telematics. By tracking how vehicles move across the road network, probe datasets provide detailed insight into traffic speeds, travel times, congestion patterns, and corridor performance.
Location-based data, sometimes described as crowd-sourced mobility data, is derived from aggregated location signals generated by mobile devices and digital applications. These datasets provide a broader view of how people move through transportation systems across multiple modes, including driving, transit, walking, and cycling.
Modern mobility analytics platforms can ingest probe vehicle data or location-based datasets to better understand both vehicle traffic conditions and multimodal travel patterns across entire cities and regions.

Common examples:
- Navigation system GPS probe data
- Connected vehicle data and fleet telematics
- Location-based service (LBS) mobility data from mobile devices and applications
What it can measure:
- Travel speeds across road segments
- Corridor and route travel times
- Origin–destination (OD) travel flows
- Traffic volumes (model-estimated from probe data)
- Travel time reliability metrics (e.g., variability, buffer time)
Modes it can measure:
- Passenger vehicles
- Fleet vehicles
- Public transit vehicles
- Taxis and ride-hailing vehicles
- Cyclists and pedestrians (primarily through location-based mobility datasets)
Key characteristics:
- Network-wide geographic coverage
- Real-time and historical data availability
- No roadside hardware required
- Scalable coverage across cities and regions
Because millions of vehicles generate location signals through navigation systems and connected services, sensor-free mobility datasets now provide an unprecedented view of how transportation networks operate. This shift has made network-scale transportation analytics possible for the first time.
Traffic data collection methods and technologies
The tables below summarize key traffic and mobility data collection methods and technologies, along with the types of metrics they produce and their key limitations.
Manual traffic studies

Sensor-based data collection
Network-scale mobility data

Combining traffic data collection approaches
Transportation practitioners today have more data collection tools than ever before. Manual field studies, roadside sensors, and network-scale mobility datasets each measure transportation systems in different ways. While some traditional approaches remain essential, others may eventually be replaced by large-scale mobility datasets. Used together, these approaches provide the most complete understanding of how transportation systems operate.

Manual traffic studies and roadside sensors provide precise measurements at specific locations. They remain essential for ground-truth validation, signal timing analysis, infrastructure monitoring, and detailed operational studies where high accuracy is required.
At the same time, advances in large-scale mobility datasets are beginning to reshape how some traffic conditions can be measured. For example, travel time monitoring that once relied on dedicated Bluetooth sensor networks can increasingly be derived from large-scale probe datasets. For this reason, many forward-looking agencies are beginning to explore and experiment with mobility data as part of their traffic monitoring programs.
By combining traditional measurements with network-scale mobility data, agencies can benefit from both precise local observations and broad system-wide coverage.
Learn what network-wide floating car data can deliver
Learn more about how network-wide Floating Car Data can complement traditional traffic data collection programs and can deliver metrics such as travel time, speed, and origin–destination flows to bring greater efficiency to traffic monitoring and analysis.